
Measuring Personalization Impact
Read the Result tab on a personalization to see exposure, compare variants against Control, and decide whether a variant is ready to ship.
Overview
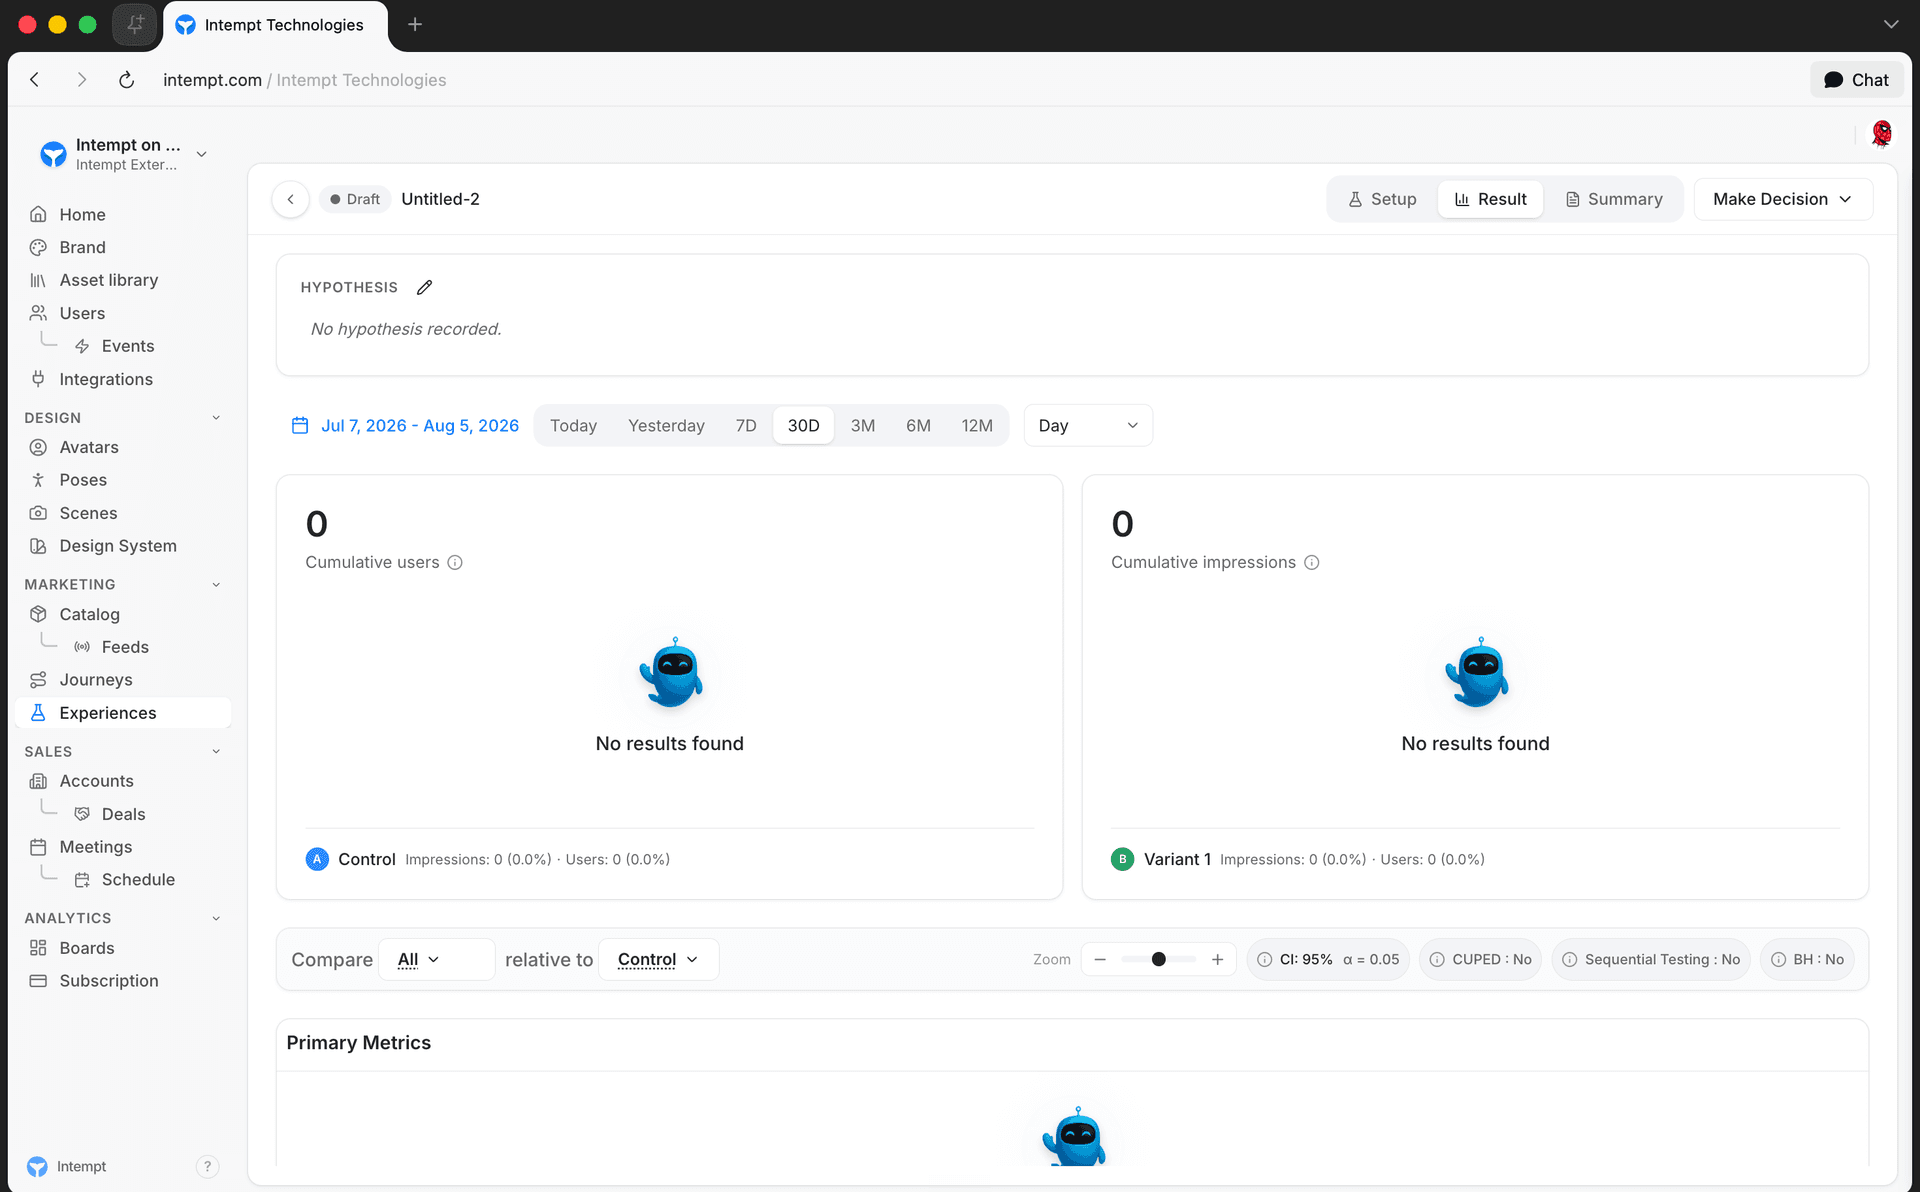
Every personalization has a Result tab, next to Setup and Summary, on its experience details page. This is where you check exposure, compare each variant against Control, and decide whether a variant is ready to ship.
Hypothesis
At the top of the Result tab, the Hypothesis card holds a short, editable statement of what you expect the personalization to do. Hover the card and click the pencil icon to edit it inline; click outside the card or press Enter to save.
Checking exposure
Below the date range and grouping controls (Day, Week, or Month), the Cumulative users and Cumulative impressions charts plot each variant's traffic over time, including Control.
📘 Good to know
Check these charts before trusting any metric below them. Balanced exposure across variants is what makes the statistical comparison valid. If one variant is getting a lot more traffic than the others, your results aren't a fair comparison yet.
Setting up the comparison
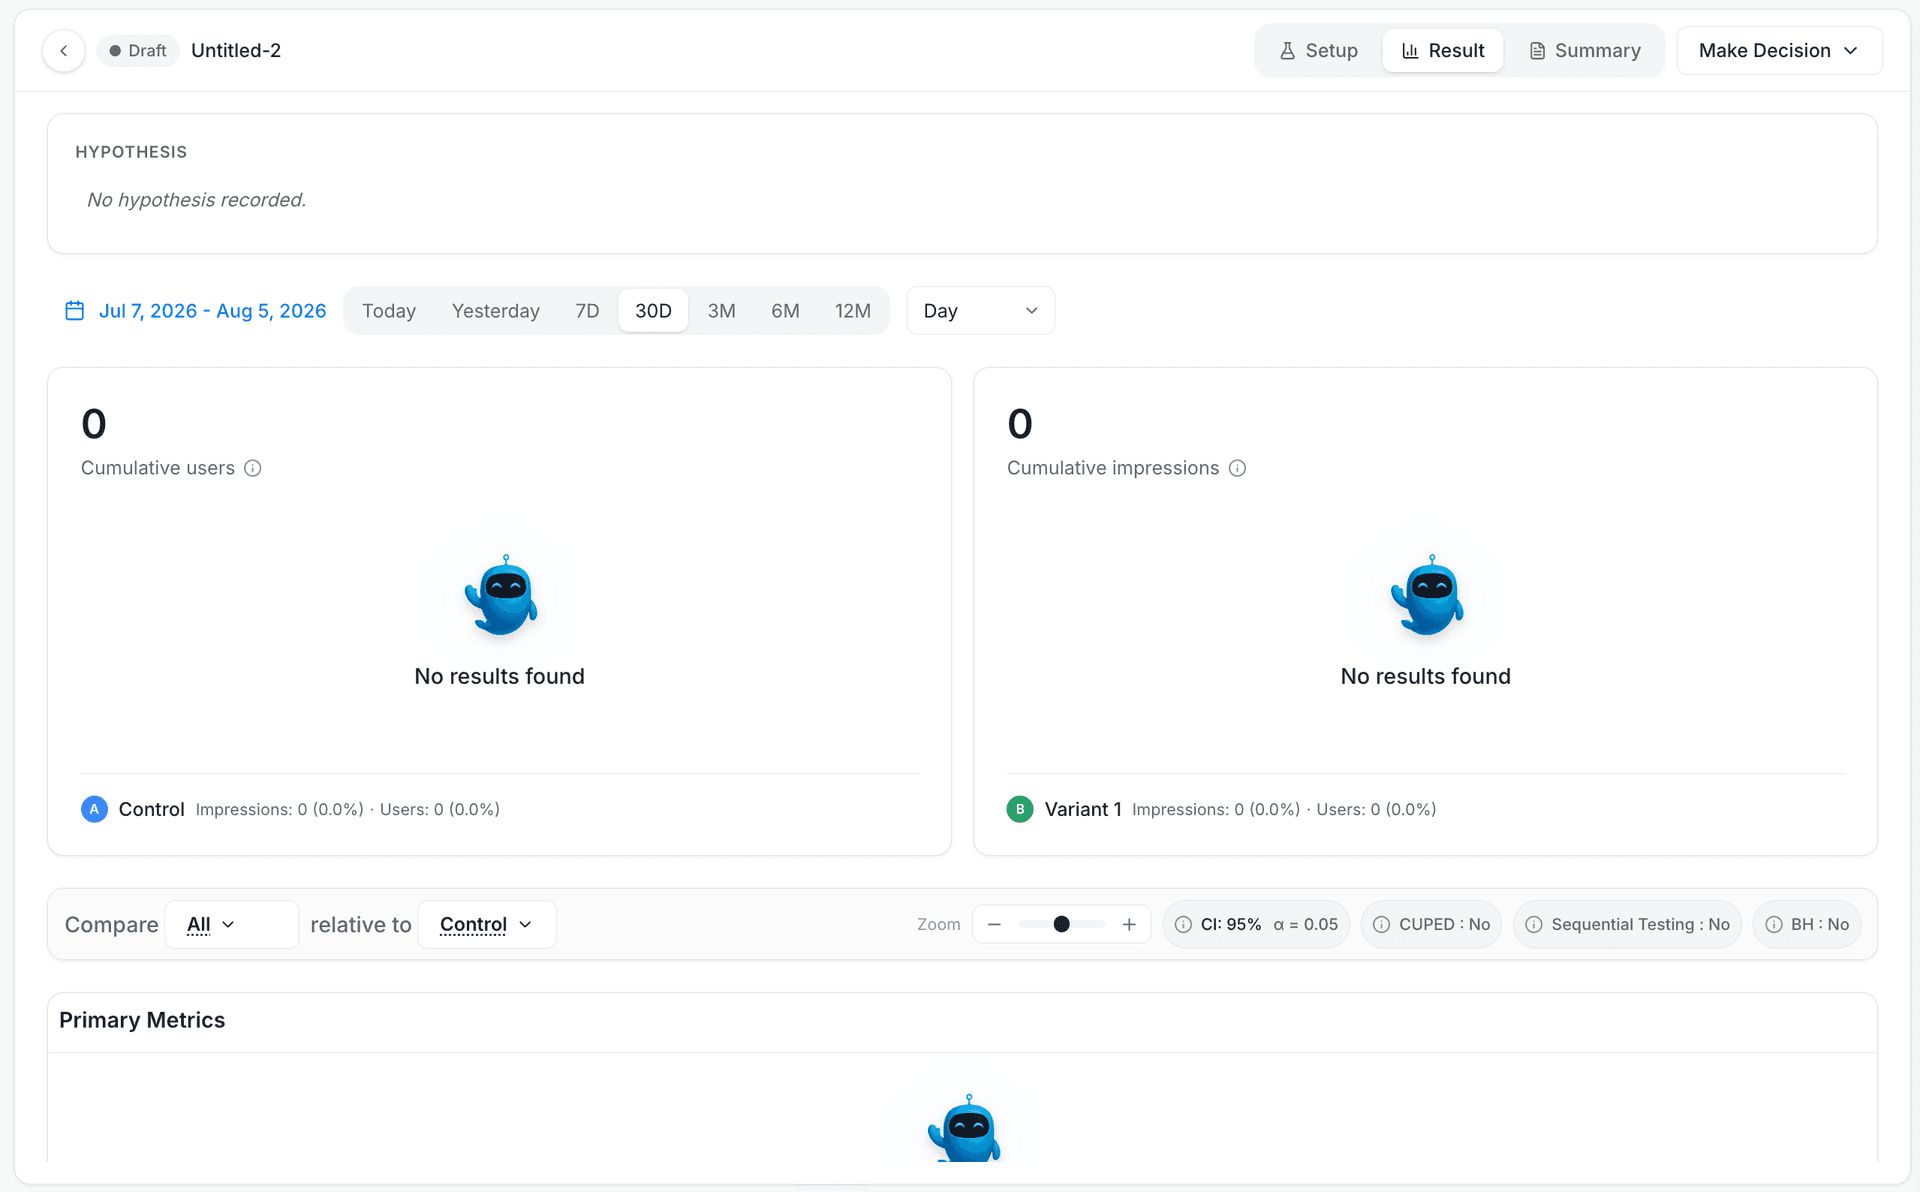
The bar above the metrics tables controls how results are computed:
- Compare / relative to. Which variant(s) to show, and which variant to measure them against. By default, Compare is set to All and relative to is set to Control.
- CI (confidence interval). Choose 80, 85, 90, 95, 98, or 99%. The button also shows the matching alpha (α); 95% CI (α = 0.05) is the default.
- CUPED. Off by default. Turning it on reduces variance using pre-experiment data, which can surface a significant result sooner.
- Sequential Testing. Off by default. Turning it on lets you call a result early once it's conclusive, instead of waiting for a fixed sample size.
- BH (Benjamini-Hochberg). Off by default. Turning it on adjusts the significance threshold across all the metrics you're testing at once, to control false positives.
- Zoom. Rescales the metric bars' axis so small deltas are easier to read.
Reading the metrics table
Metrics are split into Primary Metrics and Secondary Metrics tables. Each row is one metric; each variant gets its own line inside that row, with Control always listed for reference.
The bar for each variant marks its relative lift against the comparison variant, with a thin band showing the confidence interval around that lift:
- Green. A statistically significant positive effect.
- Red. A statistically significant negative effect.
- Gray. Not statistically significant yet.
To the right of the bar, the delta is printed as a percentage with its interval, for example +4.12% ±1.85%. Hovering the bar shows a tooltip with the same delta, the p-value, the adjusted alpha, and a side-by-side users/mean/total/standard-error comparison against Control.
Click the file icon next to a metric's name to share it to the Summary tab, so it's included in a view you can share with stakeholders who don't need the full Result tab.
📘 Media pending
Screenshot of the metrics table hasn't been captured yet.
Drilling into a metric
Click a variant's bar to open the metric's detail panel, with three tabs:
- Summary. A Ship It / Don't Ship / Keep Running verdict, alongside the lift, p-value, and sample size. Below that, a table breaks the impact into Experiment Lift, Daily Topline Impact, and Daily Projected Impact, each with an absolute and a relative value. Two cards below show Effect Size (Cohen's d, where 0.2/0.5/0.8 count as small/medium/large effects) and Yearly Projected Impact if the variant shipped to 100% of traffic.
- Time Series. The same metric plotted over the selected date range.
- Methodology. A CUPED Variance Reduction card (only shown when CUPED is turned on) and a Variant Comparison card, breaking each group down by users, mean, total, and standard error.
📘 Media pending
Screenshot of the metric detail panel hasn't been captured yet.
Use cases
- Deciding whether to ship a variant. Open its Summary tab and check the Ship It / Don't Ship / Keep Running banner before rolling it out to 100% of traffic.
- Confirming your traffic split is fair. Check the Cumulative users chart before reading any metric, especially early in a personalization's run.
- Tightening your risk tolerance. Raise the CI to 98 or 99% before shipping a change to your checkout flow, where a false positive is expensive.
- Speeding up a slow-moving test. Turn on CUPED when you have reliable pre-experiment data for the same users, to reduce variance and reach significance sooner.
- Stopping a clear winner early. Turn on Sequential Testing so you don't have to wait out a fixed sample size once a result is already conclusive.
- Testing many metrics safely. Turn on Benjamini-Hochberg when a personalization tracks several secondary metrics, so you don't chase a false positive that only looks significant by chance.
- Comparing two variants directly. Set relative to to a specific variant instead of Control, when you want to know which of two treatments performed better.
- Sharing results with stakeholders. Share the metrics that matter to the Summary tab instead of walking someone through the full Result tab.
- Sanity-checking a "Ship It" call. Open the Methodology tab to see the underlying users/mean/total/standard-error numbers behind the verdict.
- Reading small deltas. Use Zoom to rescale the metric bars when a lift is real but too small to see clearly at the default scale.
Where to go next
See Personalizations for the personalization hub, Web personalizations or Mobile personalizations for how to create the personalization you're measuring here, and Using the visual editor for building the variants themselves.
Personalizations
Personalizations allow you to make real-time visual changes on your website or application based on specified targeting conditions. It takes a piece of your site, like the promotions on the homepag...
Using the visual editor
Visual editor (VE) allows you to create multiple variants per personalization via an intuitive web page editor.