
Subscription & Billing Overview
The Subscription board tracks your organization's own subscription revenue: MRR, subscriber counts, churn, plan mix, and trial conversion, synced from Stripe.
Overview
The Subscription board is a dedicated analytics view of your organization's subscription revenue, separate from the general-purpose Boards you build yourself. It's built for tracking a subscription business: monthly recurring revenue (MRR), subscriber counts, churn, plan-level breakdowns, net revenue retention, and trial-to-paid conversion, all sourced from the Stripe source you connect to Intempt.
Find it under Analytics in the sidebar, inside Boards. It is no longer a separate sidebar entry of its own — it moved into Boards as two tabs, MRR and Subscribers, and the old /subscription route now redirects there.
📘 Good to know
This is different from your organization's own billing plan with Intempt (your seats, base fee, and usage charges). For that, see Usage & billing. The Subscription board reports on the subscriptions your organization sells to its own customers through Stripe.
Switching between MRR and Subscribers
A toggle at the top of the board switches every chart and table between two views:
- MRR: dollar values, current MRR, MRR movements, MRR by plan.
- Subscribers: headcount values, total subscriber count, subscriber movements, subscribers by plan.
The KPI cards, trend chart, movements table, and plan breakdown chart all follow this toggle.
KPI cards and goals
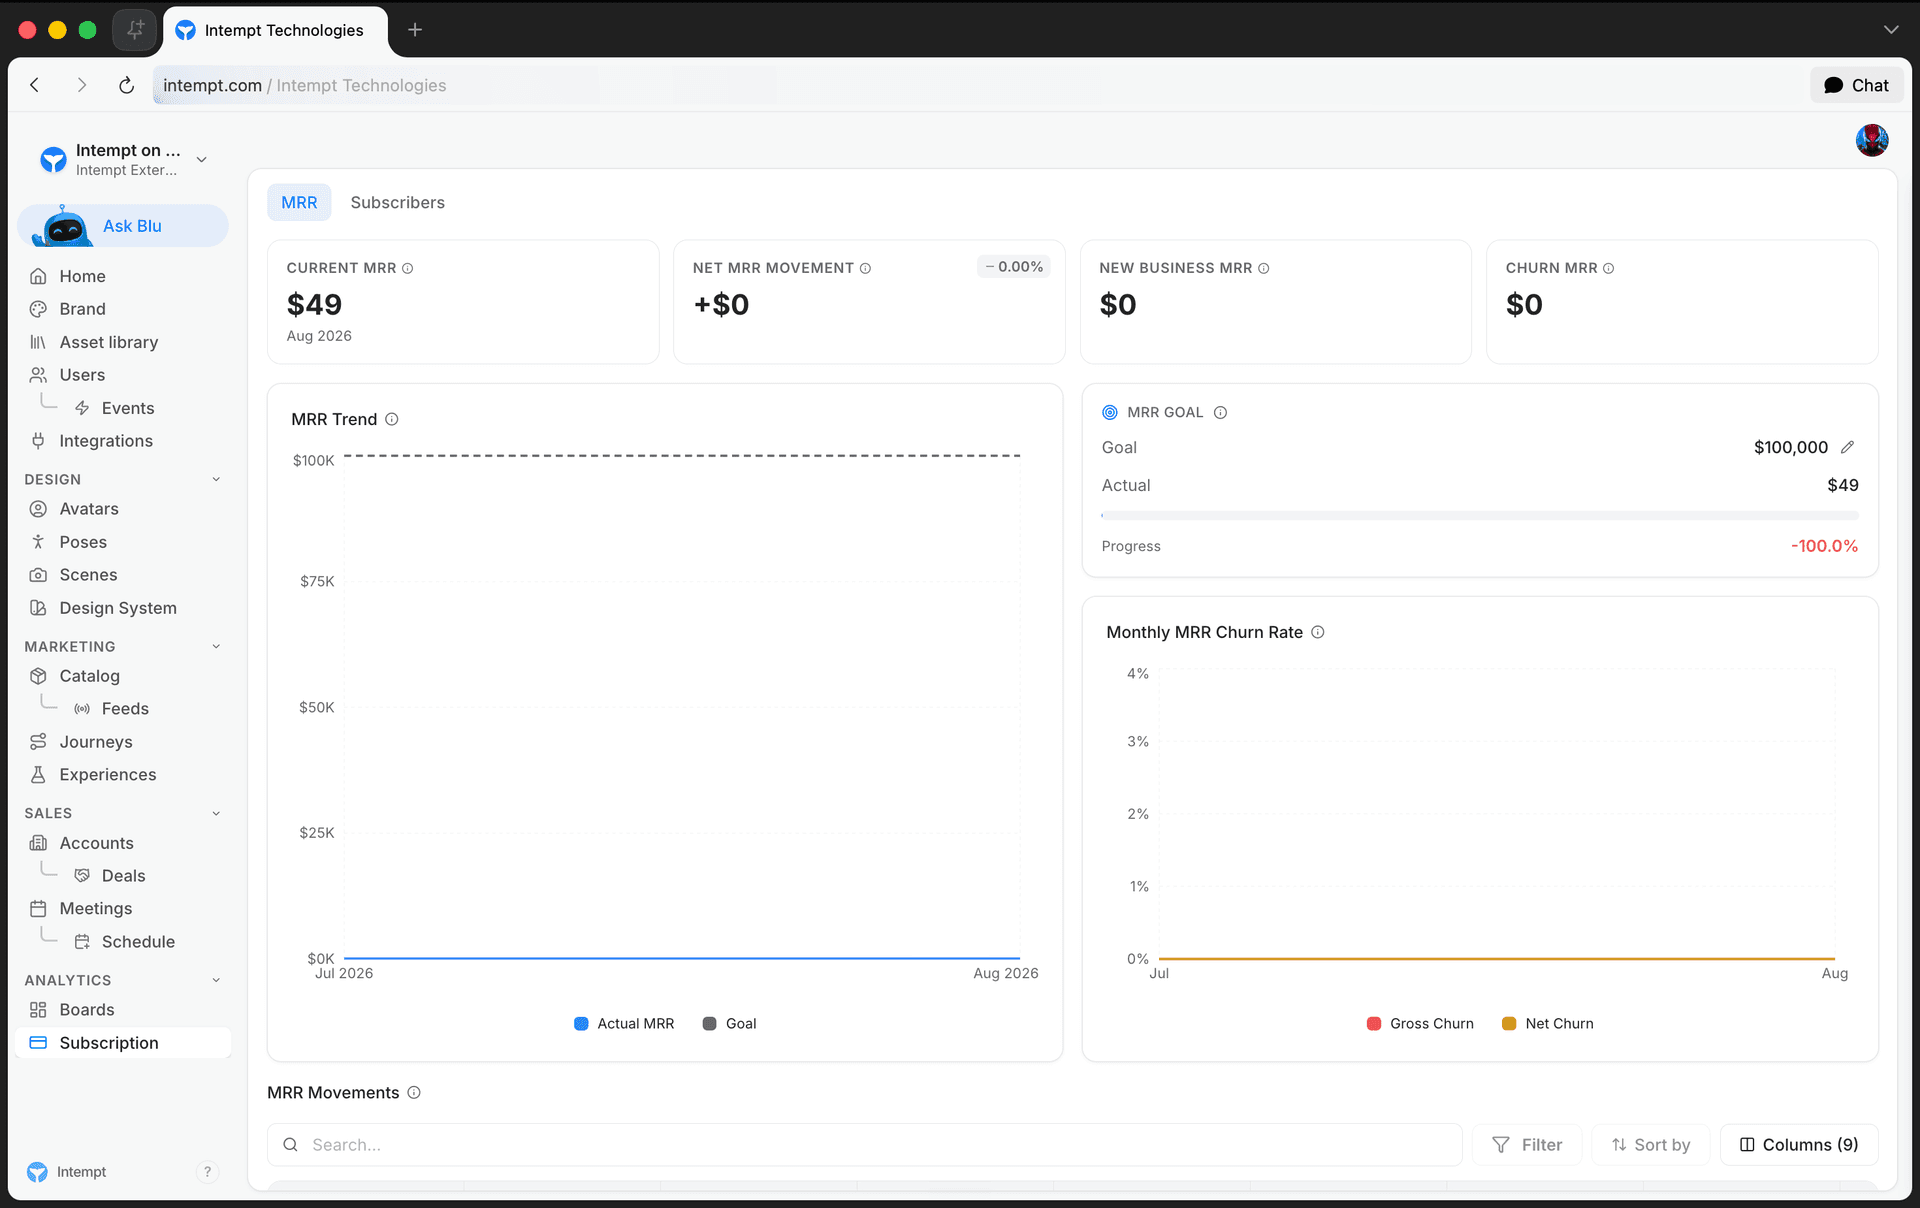
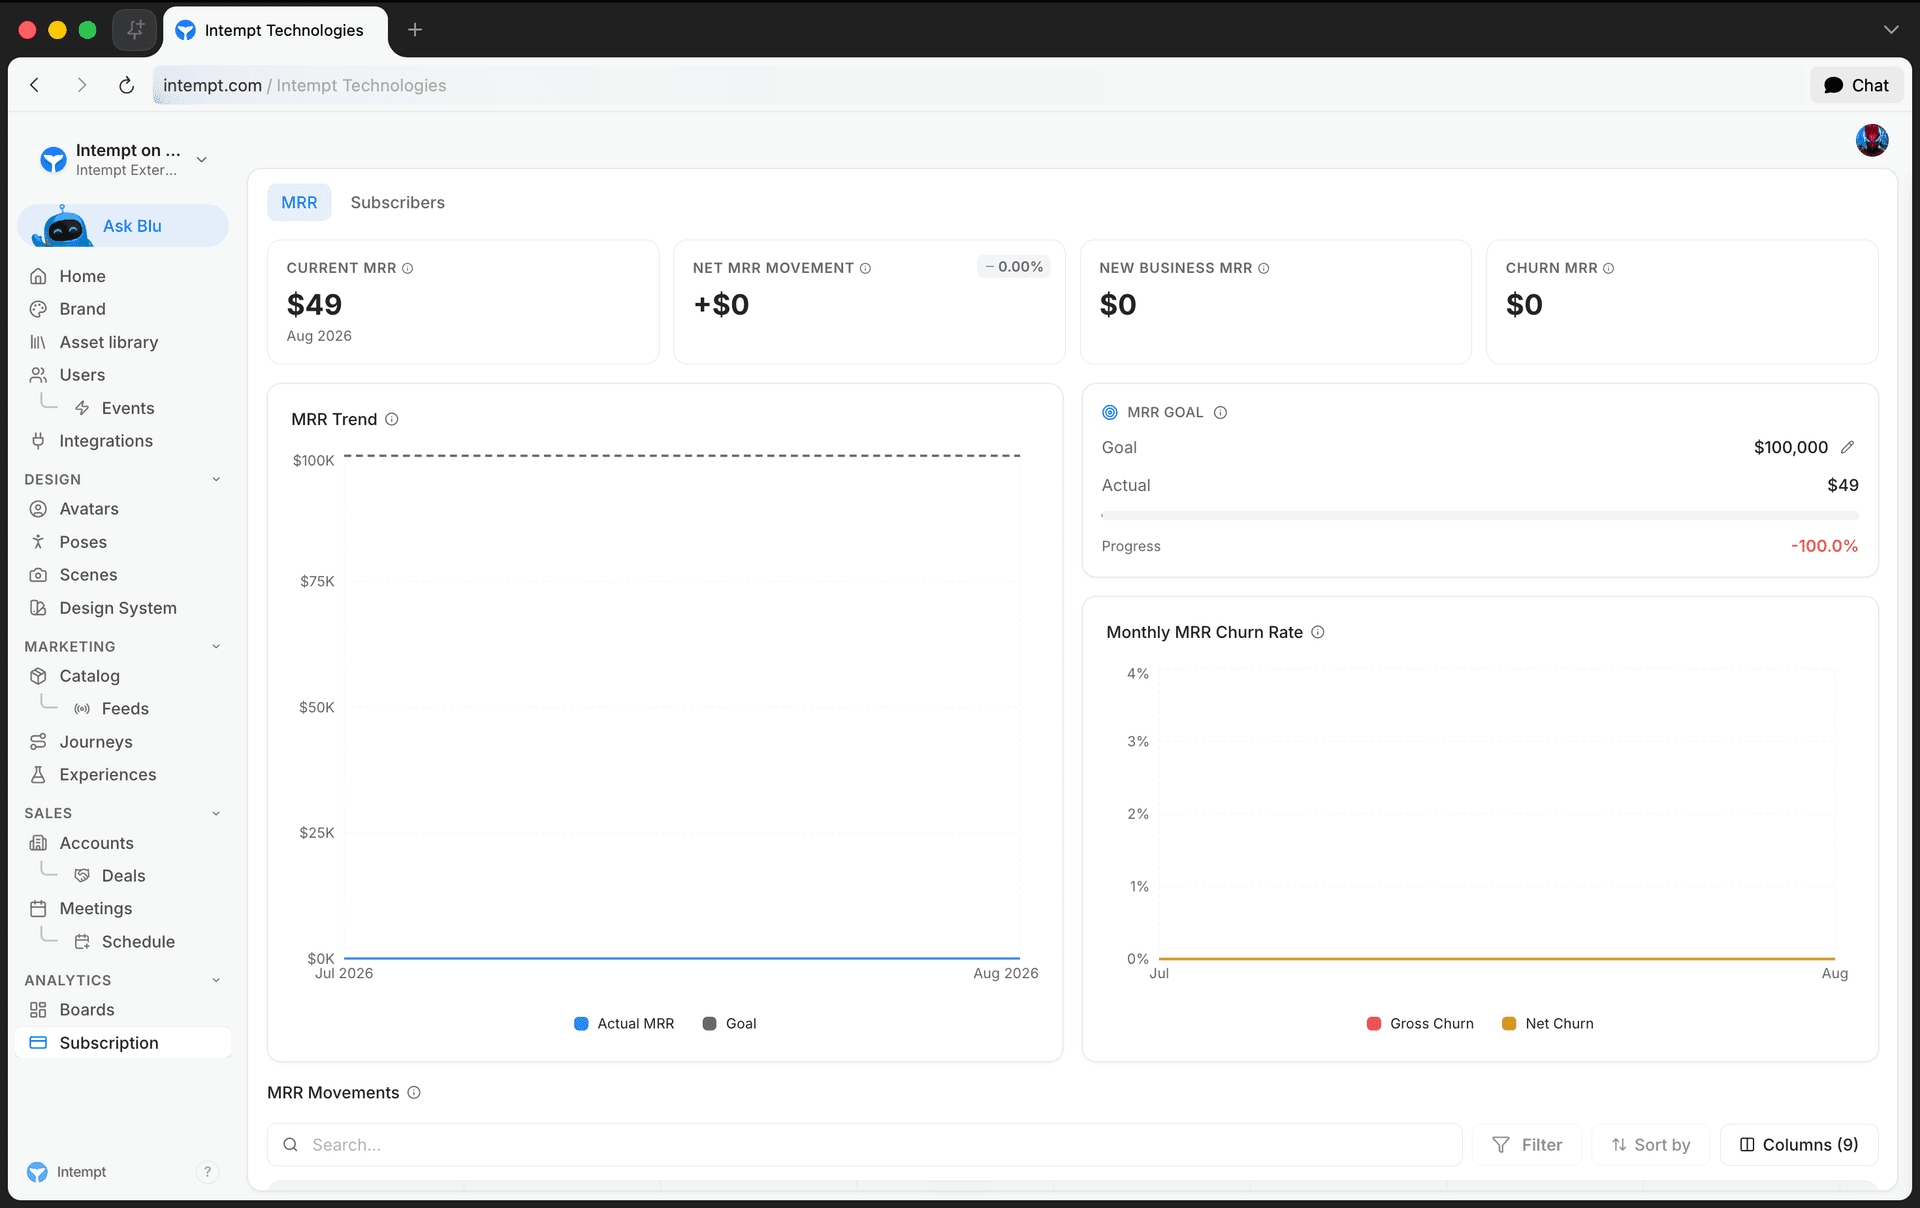
Four KPI cards sit at the top of the board. Which four you see depends on the MRR/Subscribers toggle:
| MRR view | Subscribers view |
|---|---|
| Current MRR | Total Subscribers |
| Net MRR Movement | Net Change |
| New Business MRR | New Subscribers |
| Churn MRR | Churned |
Below the KPI cards is a goal card. It compares your actual MRR (or subscriber count) against a target you set, with a progress bar and a percentage that turns green once you're at or above goal. Select the pencil icon next to the goal value to edit it.
Trend and churn charts
The MRR/Subscriber Trend chart plots your actual value against your goal over time, month by month.
The Churn Rate chart below it shows gross churn (all cancellations) against net churn (cancellations offset by expansion revenue) for the last six months.
Movements table
The movements table breaks down what changed each month:
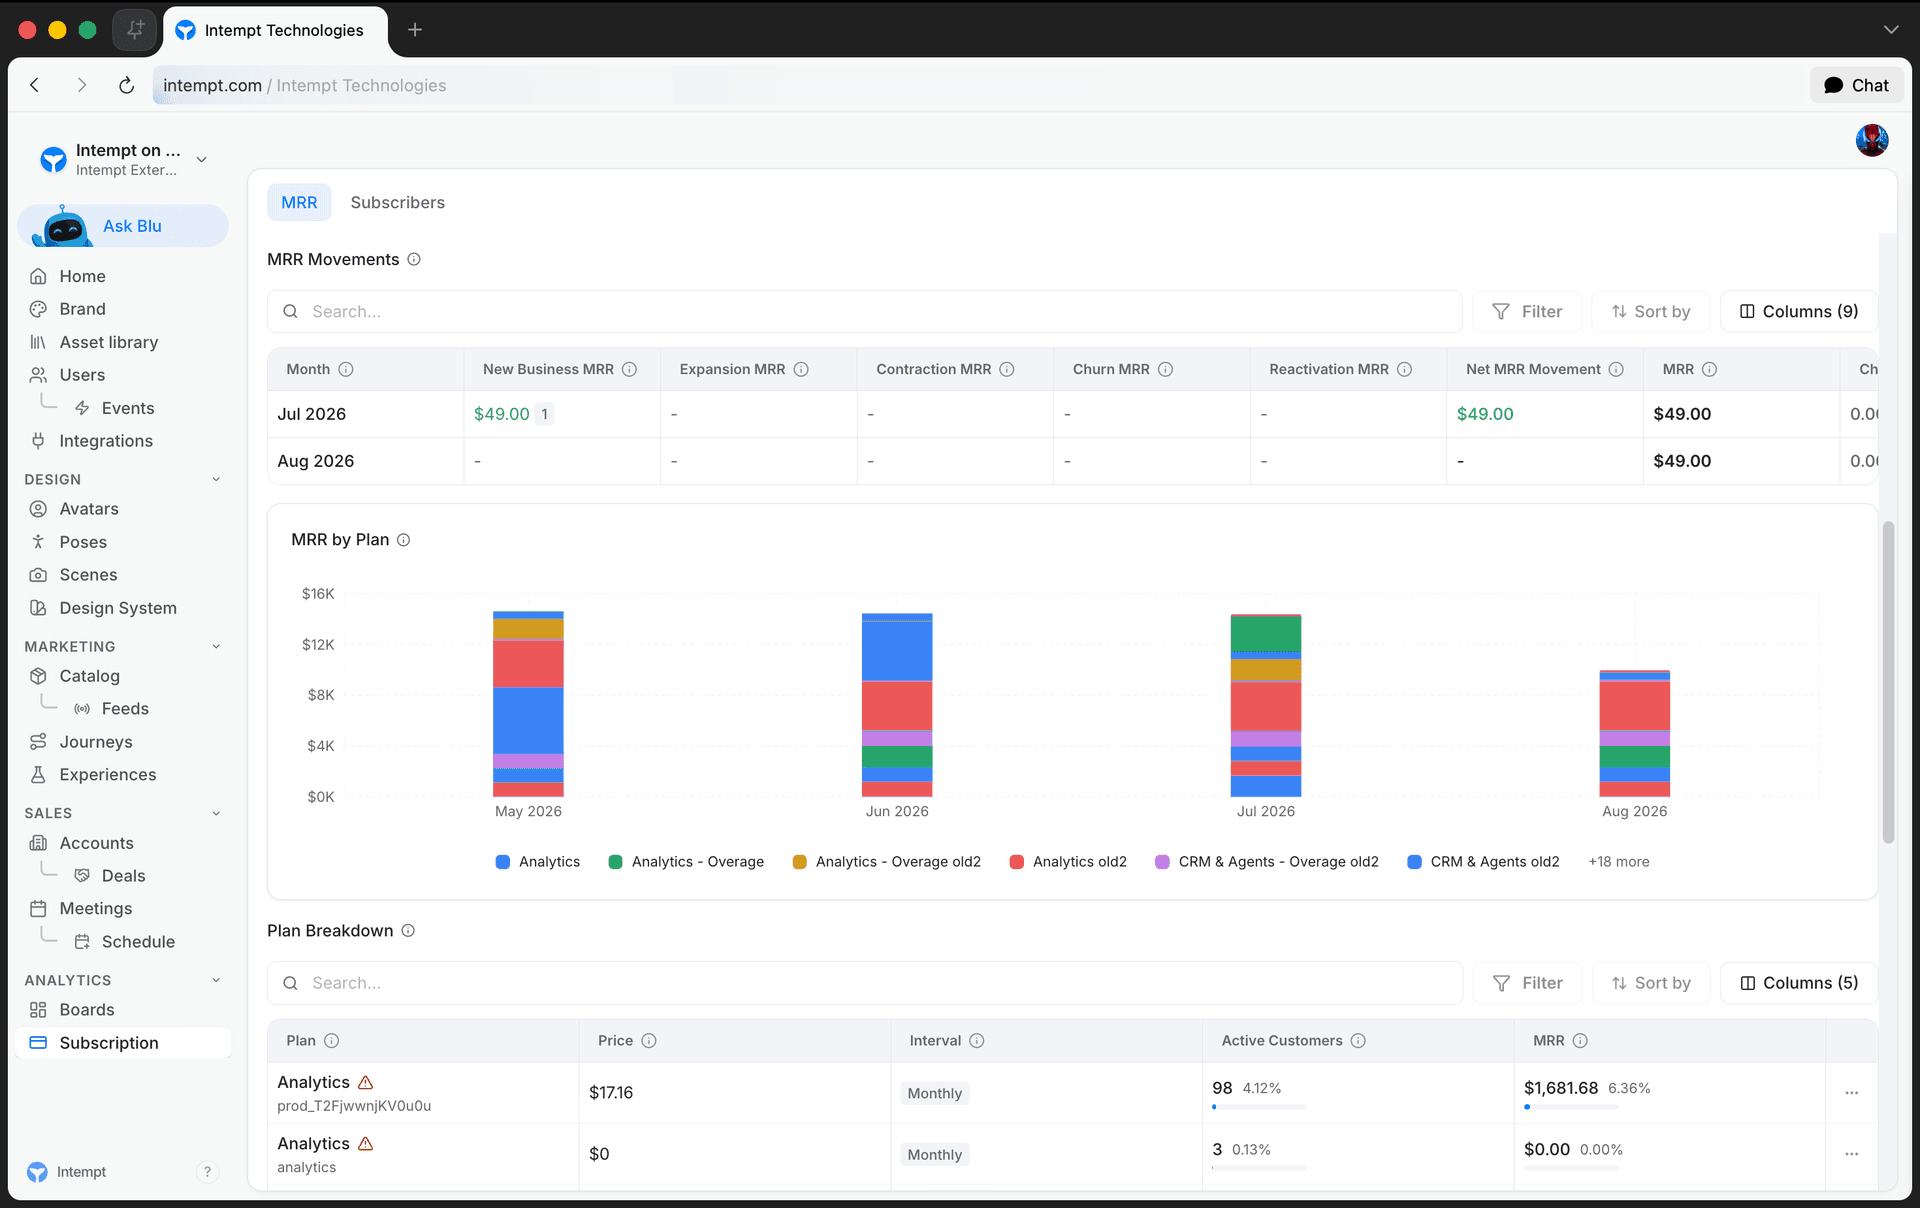
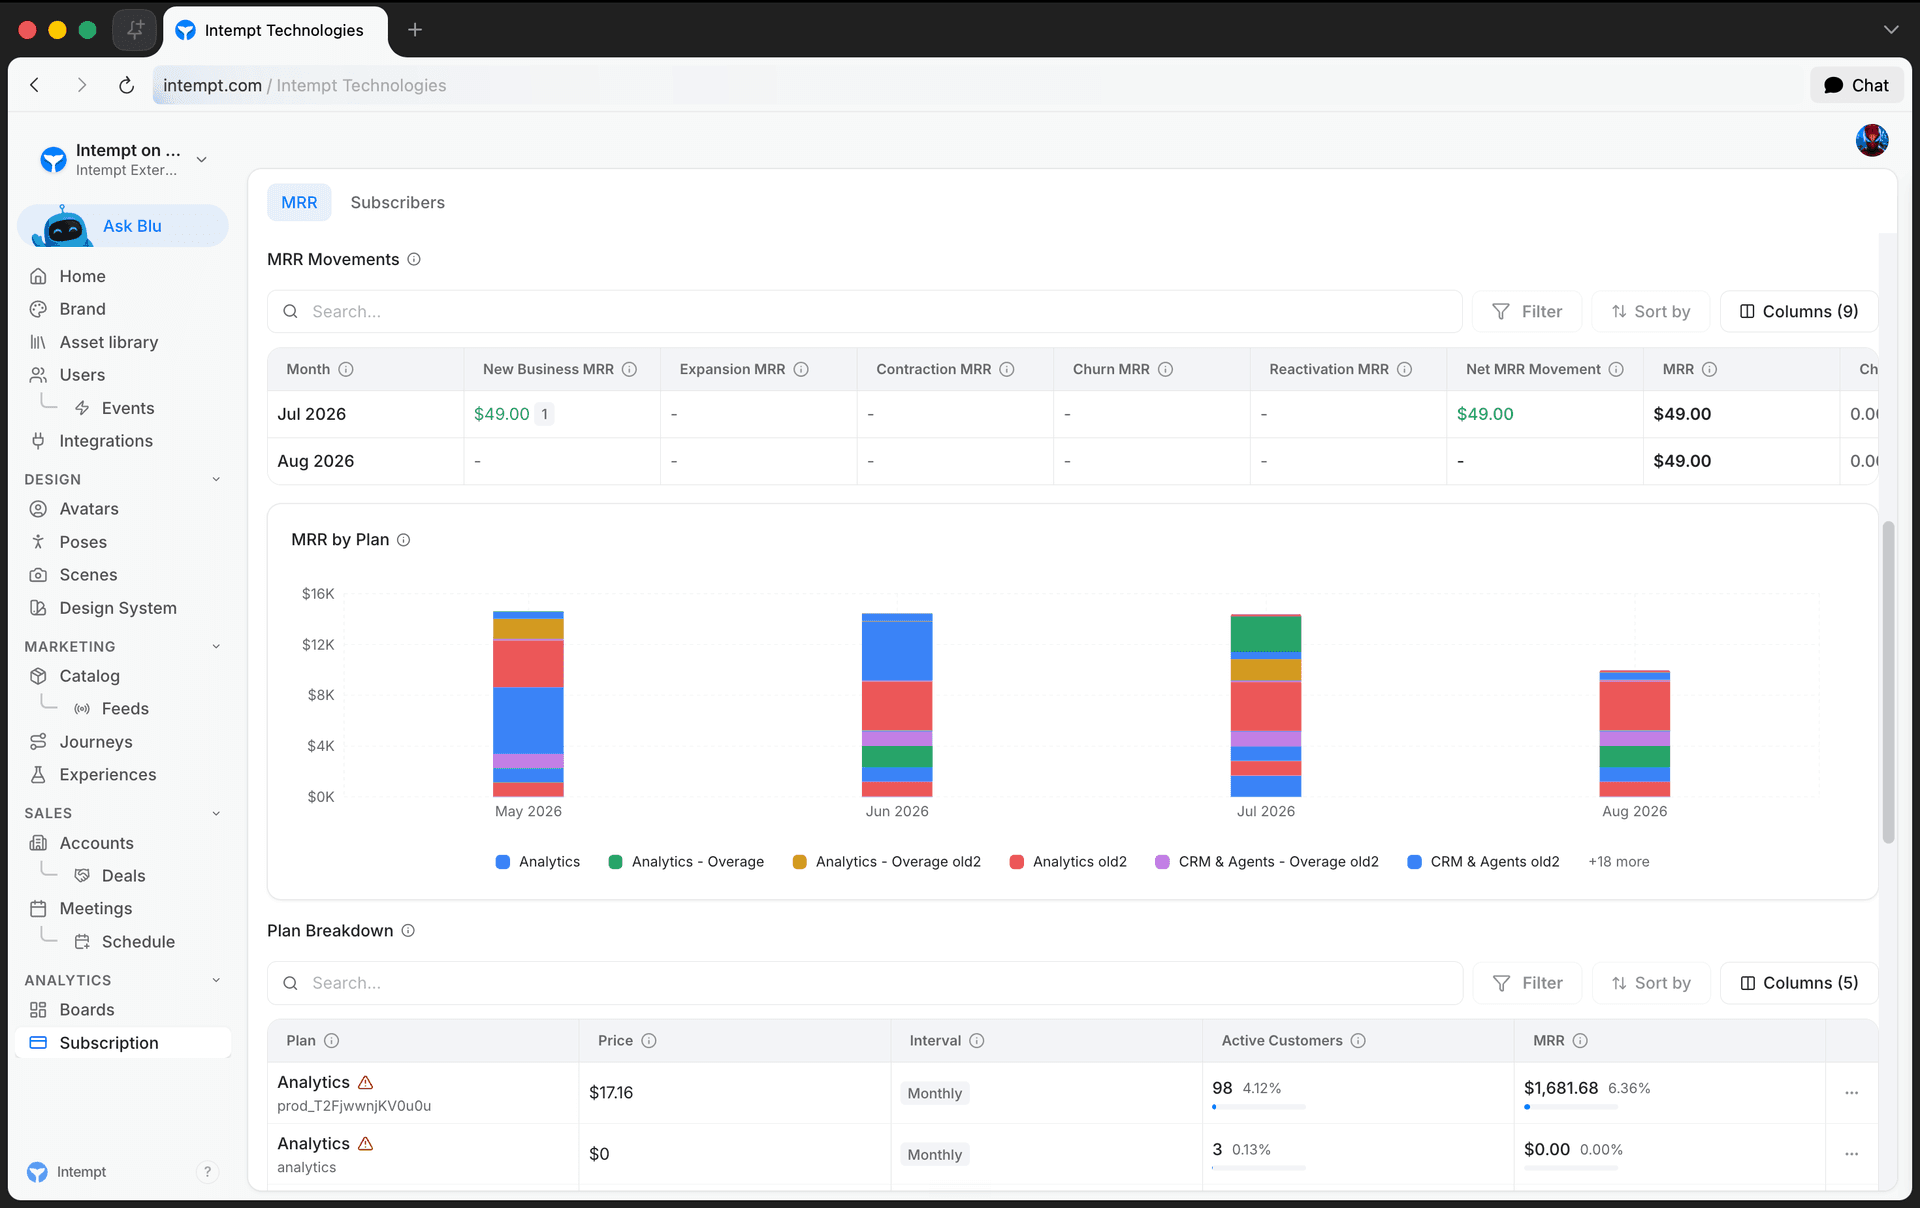
- MRR view: New Business, Expansion, Contraction, Churn, and Reactivation MRR (each cell shows the affected subscriber count on hover), plus Net MRR Movement, Total MRR, and the month-over-month percentage change.
- Subscribers view: New Subscribers, Reactivated, Churned, Net Change, Total Subscribers, and the percentage change.
Plans breakdown
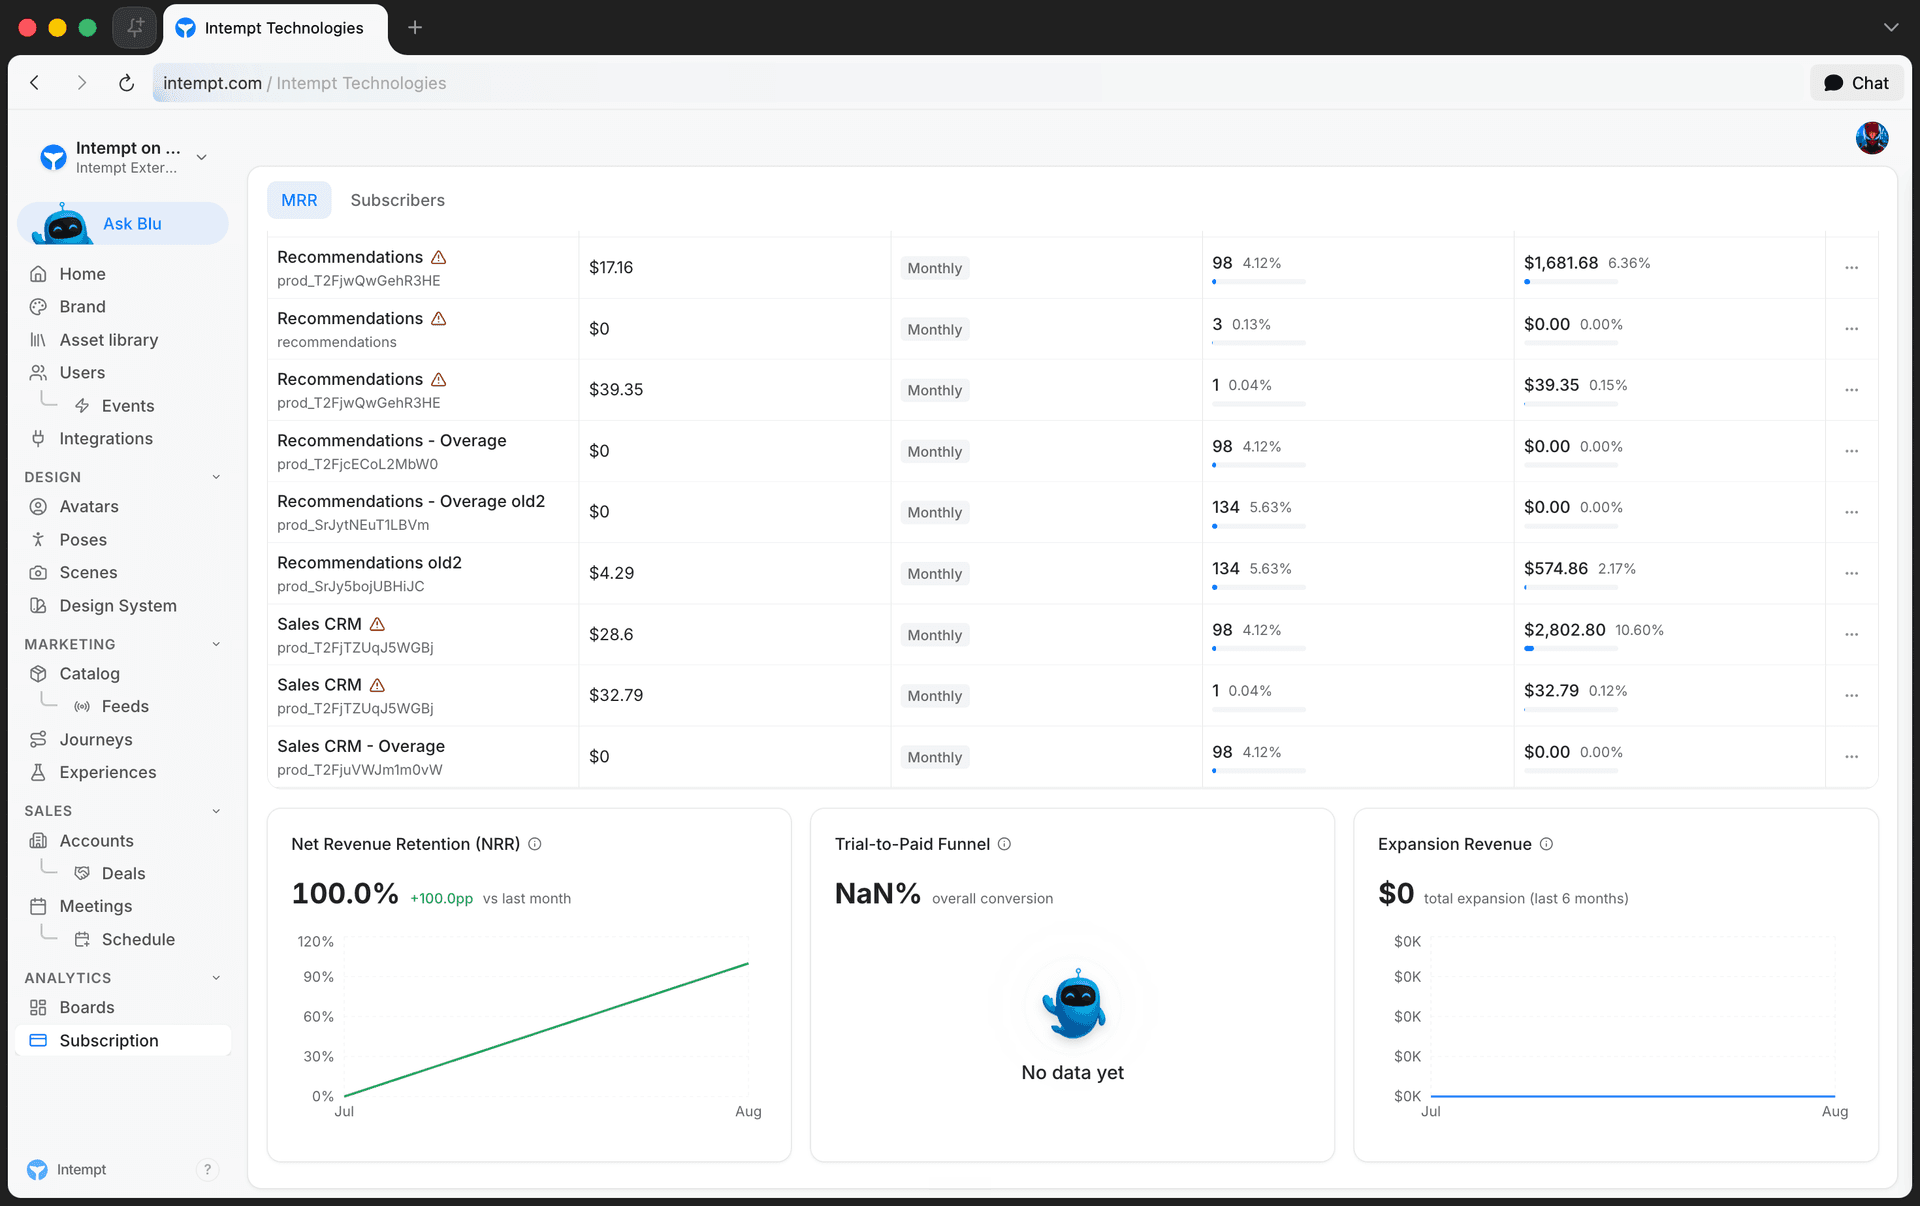
A stacked bar chart shows MRR (or subscribers) split by plan, month by month. Below the chart, a table lists each plan with its price, billing interval (Monthly or Annually), active customer count with percentage share, and (in MRR view) MRR contribution with percentage share.
If two plans share the same name, a warning icon appears next to them, pointing you to check your Stripe dashboard to tell them apart.
Retention and trial conversion
Three more panels round out the board:
- Net Revenue Retention (NRR). Current NRR percentage and change versus last month. NRR above 100% means your existing customers' revenue is growing even before counting new sales, once expansion, contraction, and churn are all factored in.
- Trial-to-Paid Funnel. Overall conversion rate from trial sign-up to paid subscription, shown as a two-step funnel: Trial Started and Converted to Paid.
- Expansion Revenue. Cumulative revenue growth from existing customers upgrading or expanding, over the last six months.
Ask Blu about your subscription
A Blu banner at the top of the board gives a running summary of your subscription health and offers quick prompts, for example surfacing churn risk or upgrade opportunities. Selecting a prompt opens Blu chat with that question already filled in.
Use cases
- Catch revenue risk before the month closes. Watch Net MRR Movement and Churn MRR mid-month instead of waiting for a finance close.
- Track progress toward a revenue target. Set an MRR goal and watch the progress bar move as the month plays out.
- Spot duplicate Stripe products. The warning icon on the plans table flags when two plans share a name, so you can clean up your Stripe catalog.
- Judge whether growth is healthy or just wide. Toggle between MRR and Subscribers to see whether revenue growth is coming from more subscribers or from existing subscribers paying more.
- Evaluate your trial funnel. Use the Trial-to-Paid conversion rate to decide whether a pricing or onboarding change actually moved the needle.
- Check whether expansion is offsetting churn. Read the NRR trend alongside Expansion Revenue to see if upsells are covering what churn is costing you.
- Pull numbers for a board update. The movements table gives a ready month-by-month breakdown of new business, expansion, contraction, churn, and reactivation.
- Ask Blu for upgrade candidates. Use the quick prompts in the Blu banner instead of digging through the plans table by hand.
Where to go next
See Stripe for connecting the source this board reads from, Usage & billing for how Intempt itself bills your organization, and Dashboards for building your own custom analytics boards.