
Building a dashboard
A dashboard brings together reports, journey results, experience results, and text notes on one board, all filterable by a shared date range.
Covered in the Academy. Intempt Academy covers analytics part 2: dashboards step by step.
Overview
A dashboard is a customizable board where you place reports, journey results, experience results, and text notes so you can track what matters at a glance. Every widget on the board shares the same date range, and you can arrange, resize, and edit each one independently.
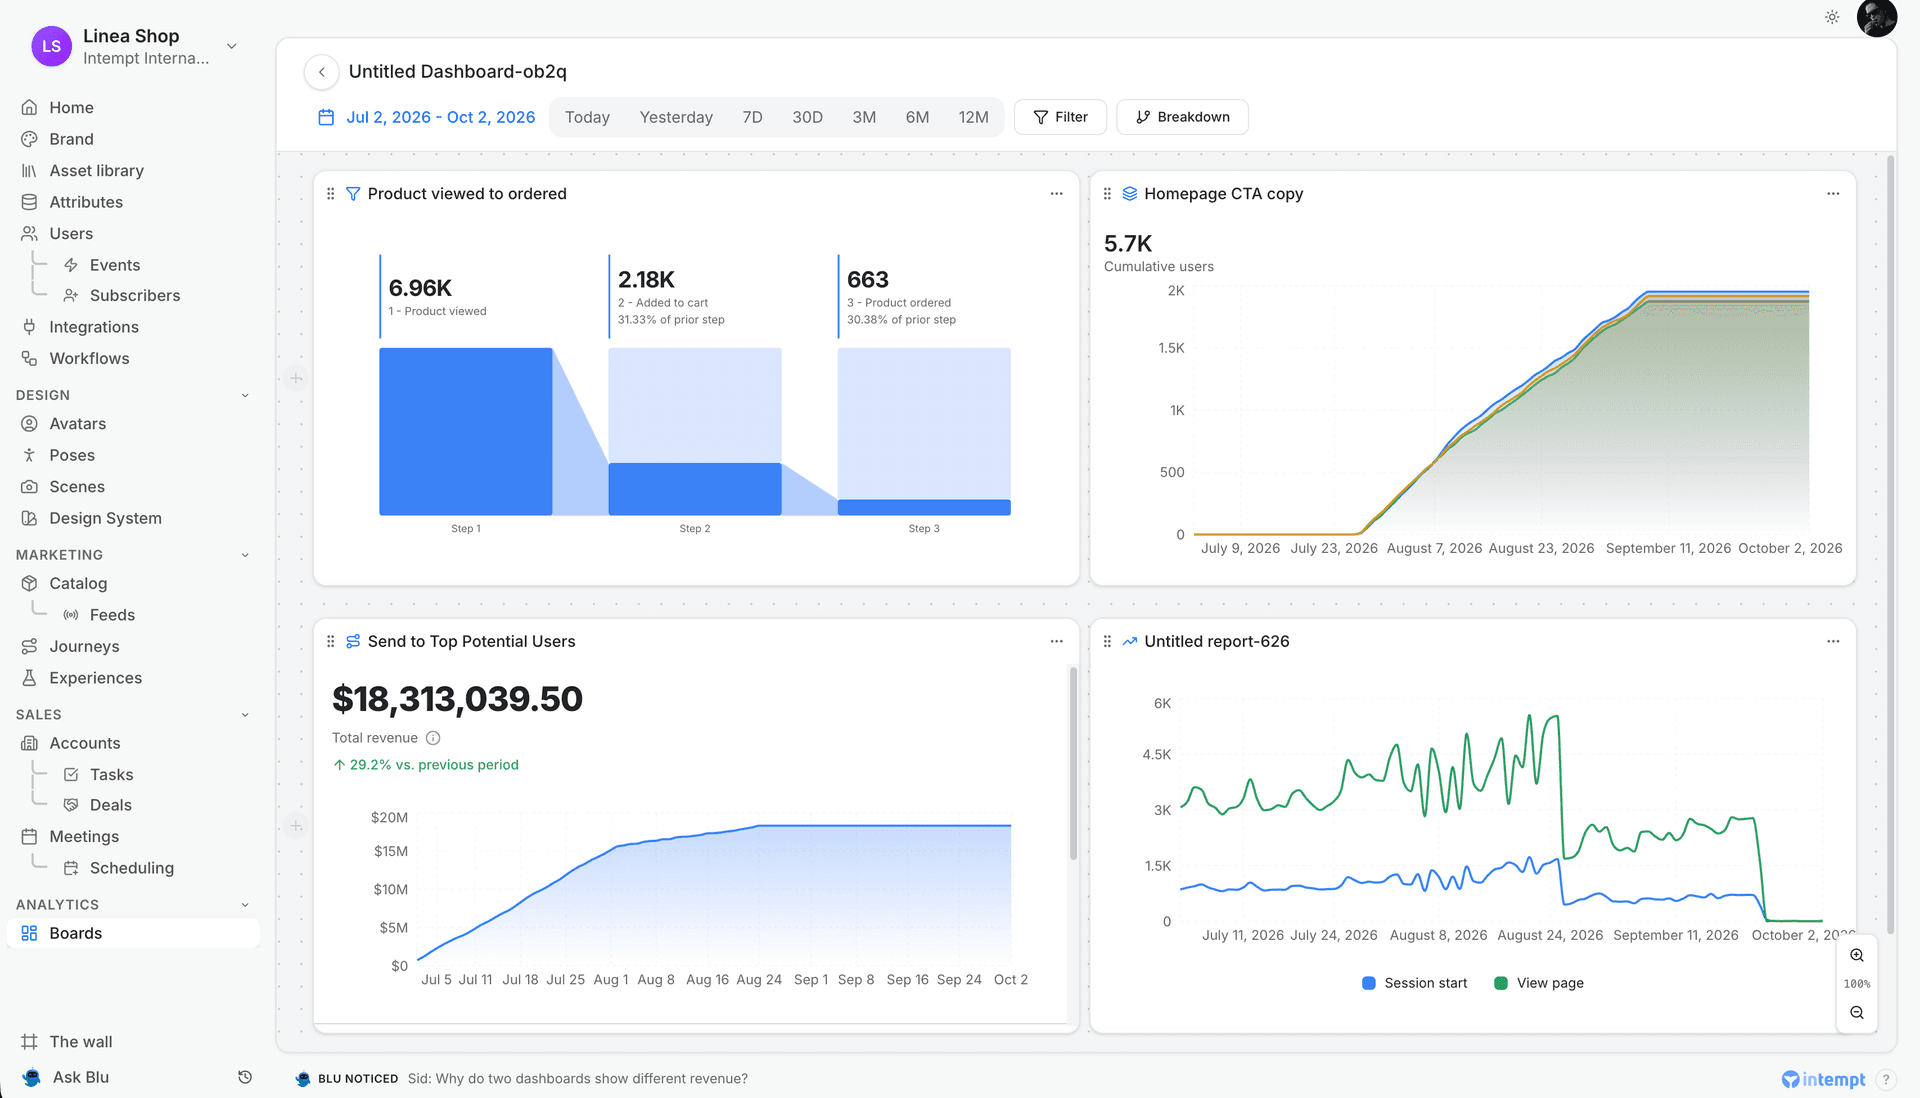
Getting started
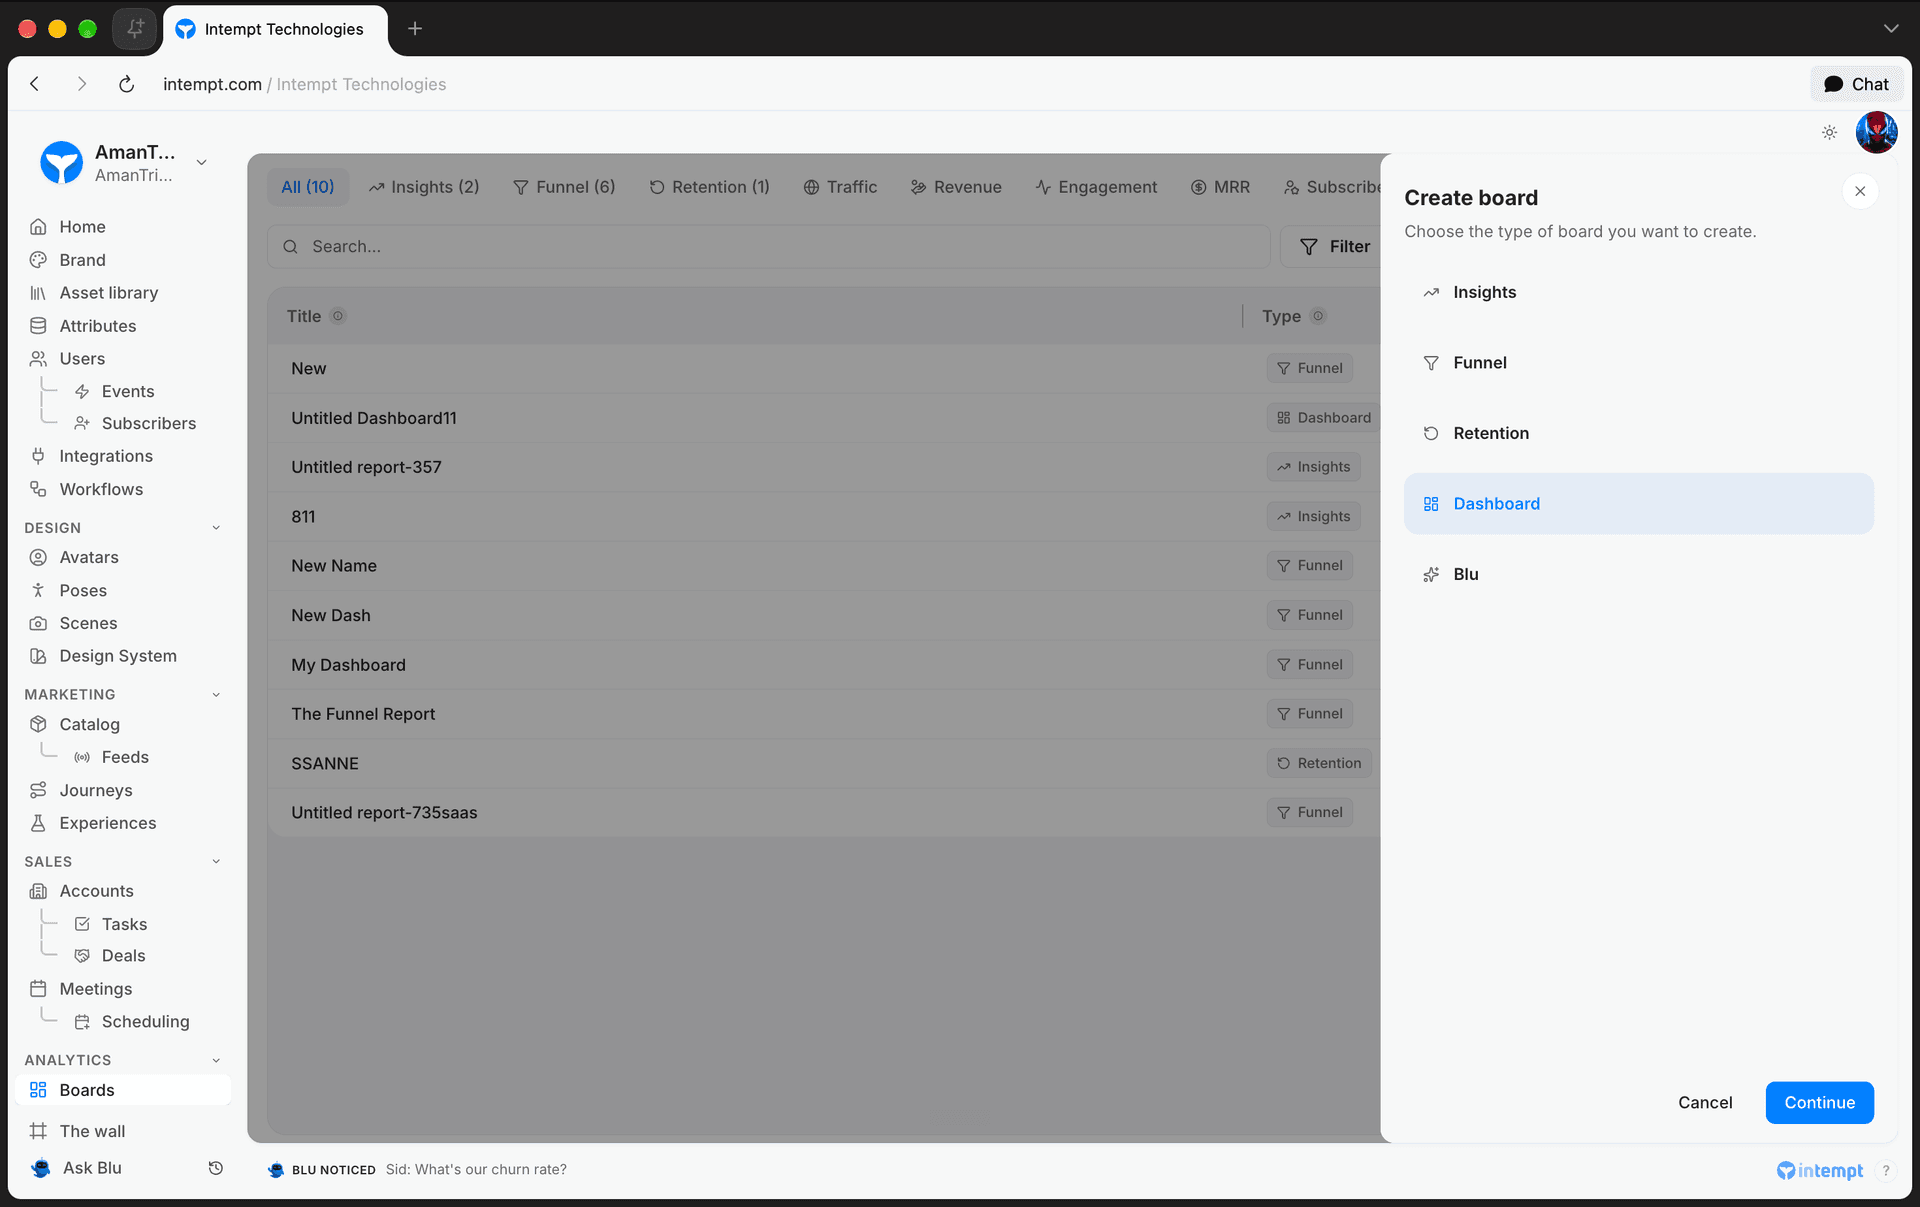
Open the Analytics group in the sidebar and click Boards. Reports and dashboards live in the same list: click Create board, pick Dashboard, then click Continue.
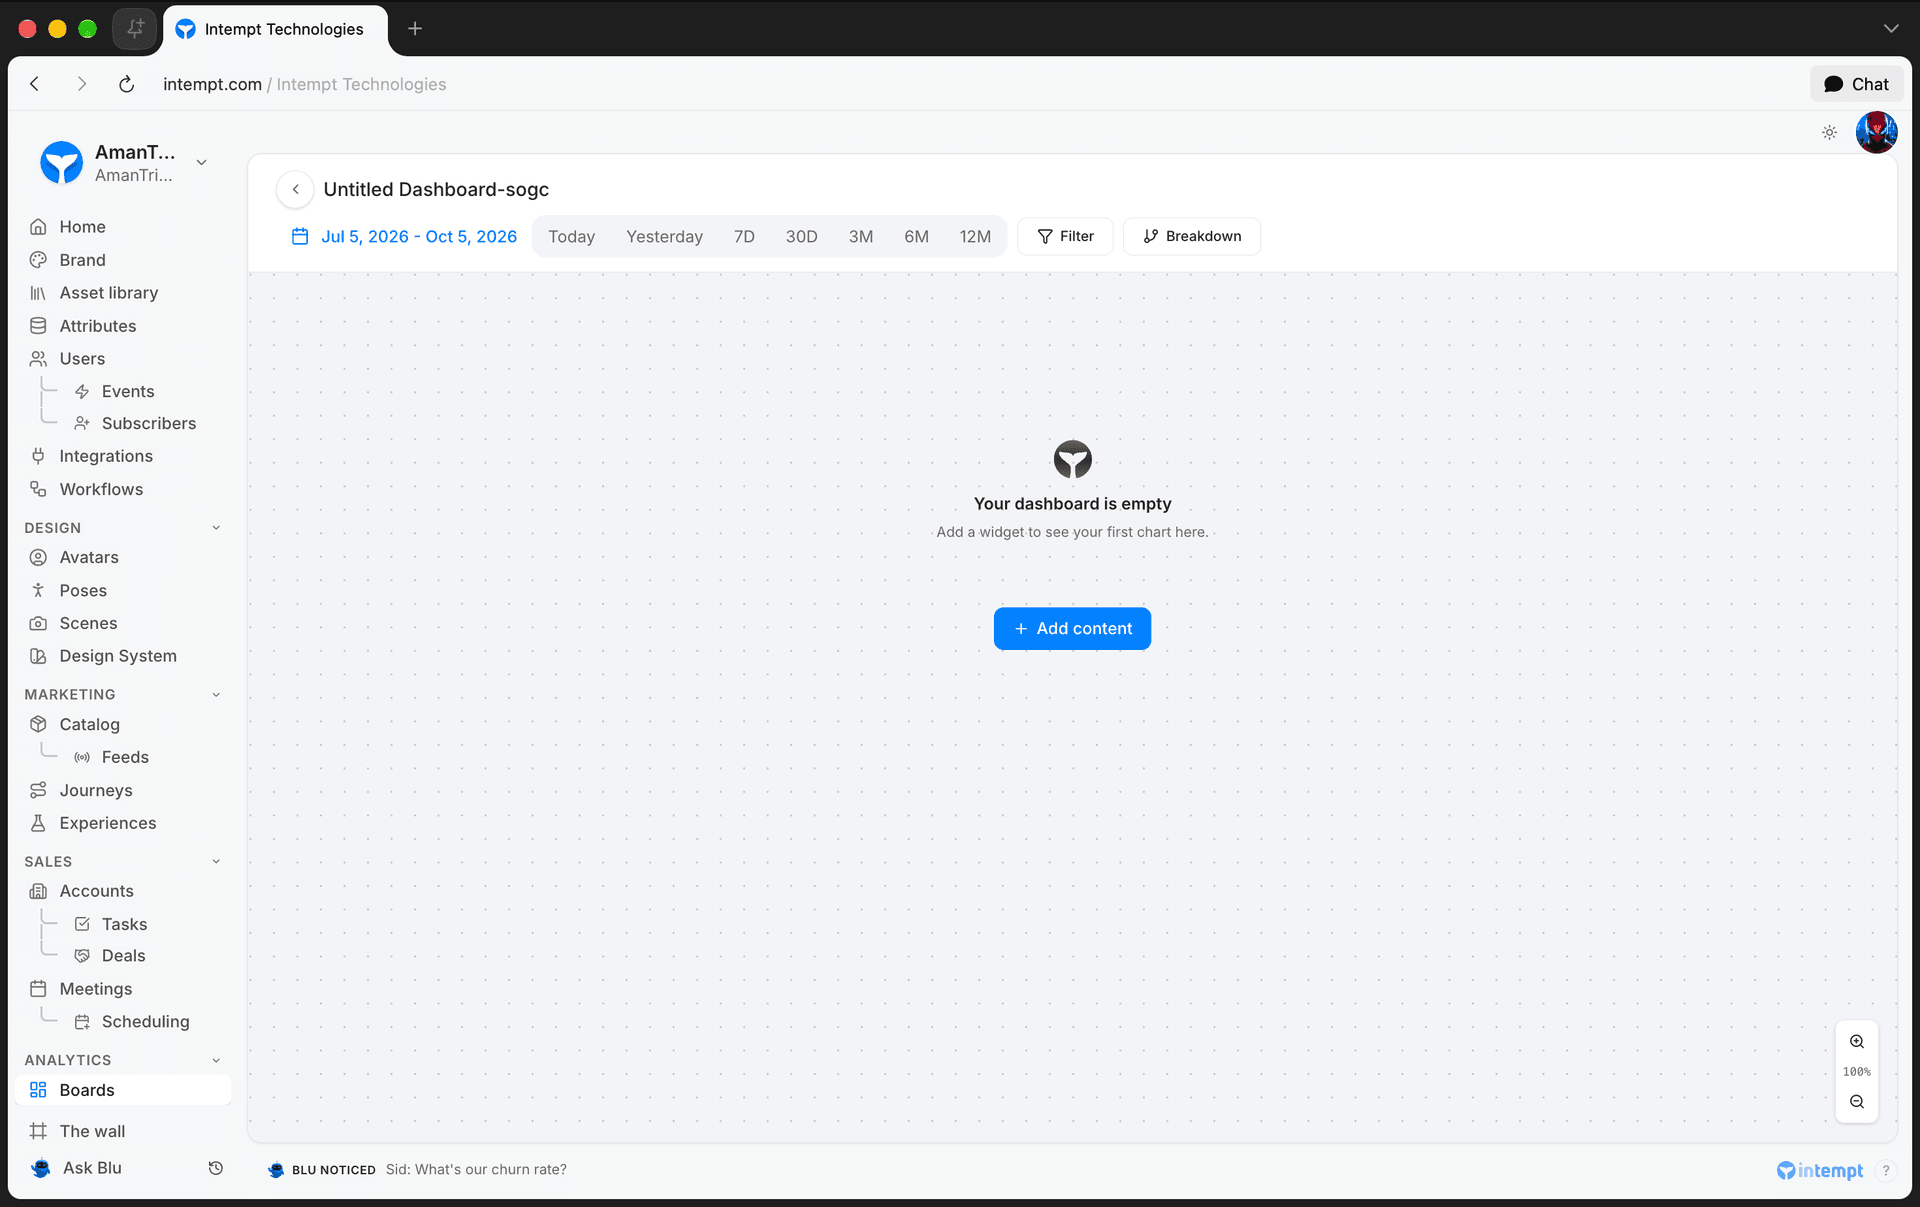
A new dashboard opens empty. Select Add content to start adding widgets.
Choosing what to add
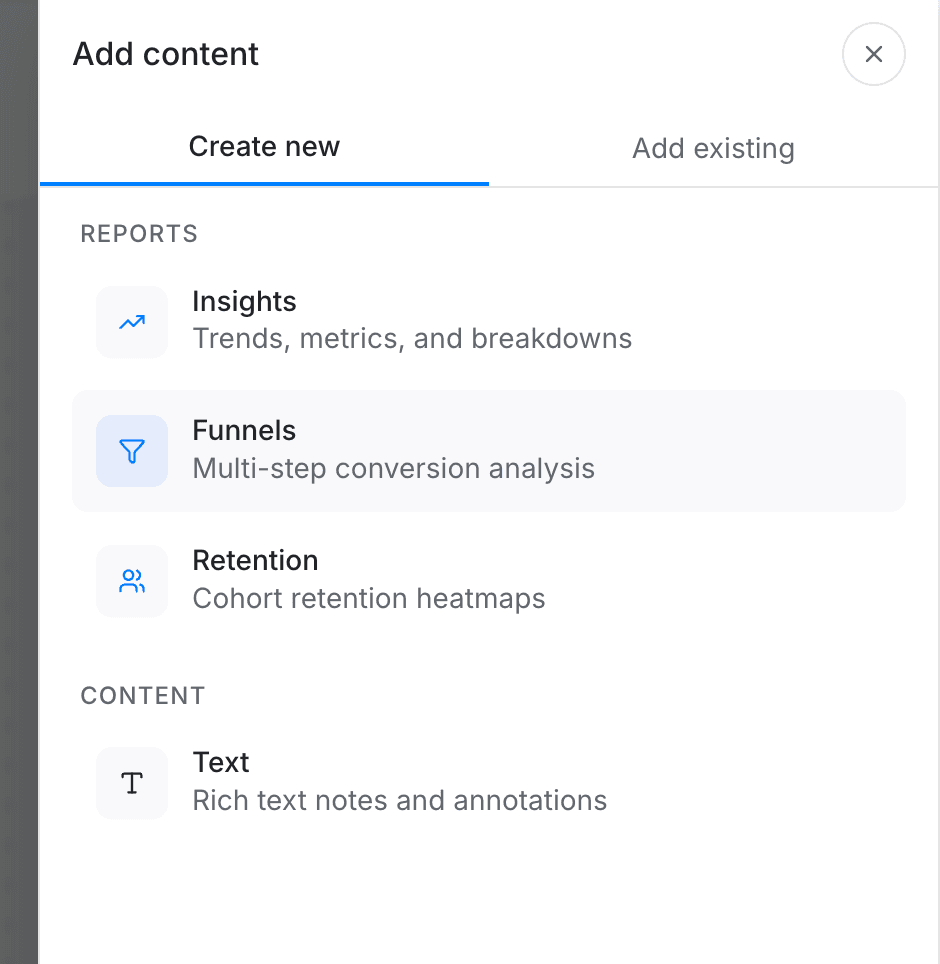
The Add content panel has two tabs:
- Create new: build a widget from scratch, an Insights, Funnel, or Retention report, or a Text block for notes and annotations.
- Add existing: pull in something you already built, an existing Insights, Funnel, or Retention report, or the results of a Journey or an Experience.
💡 Good to know
Creating a new report from a dashboard sends you to the report builder first. Once you save the report, you're returned to the dashboard with it already placed as a card.
Arranging widgets
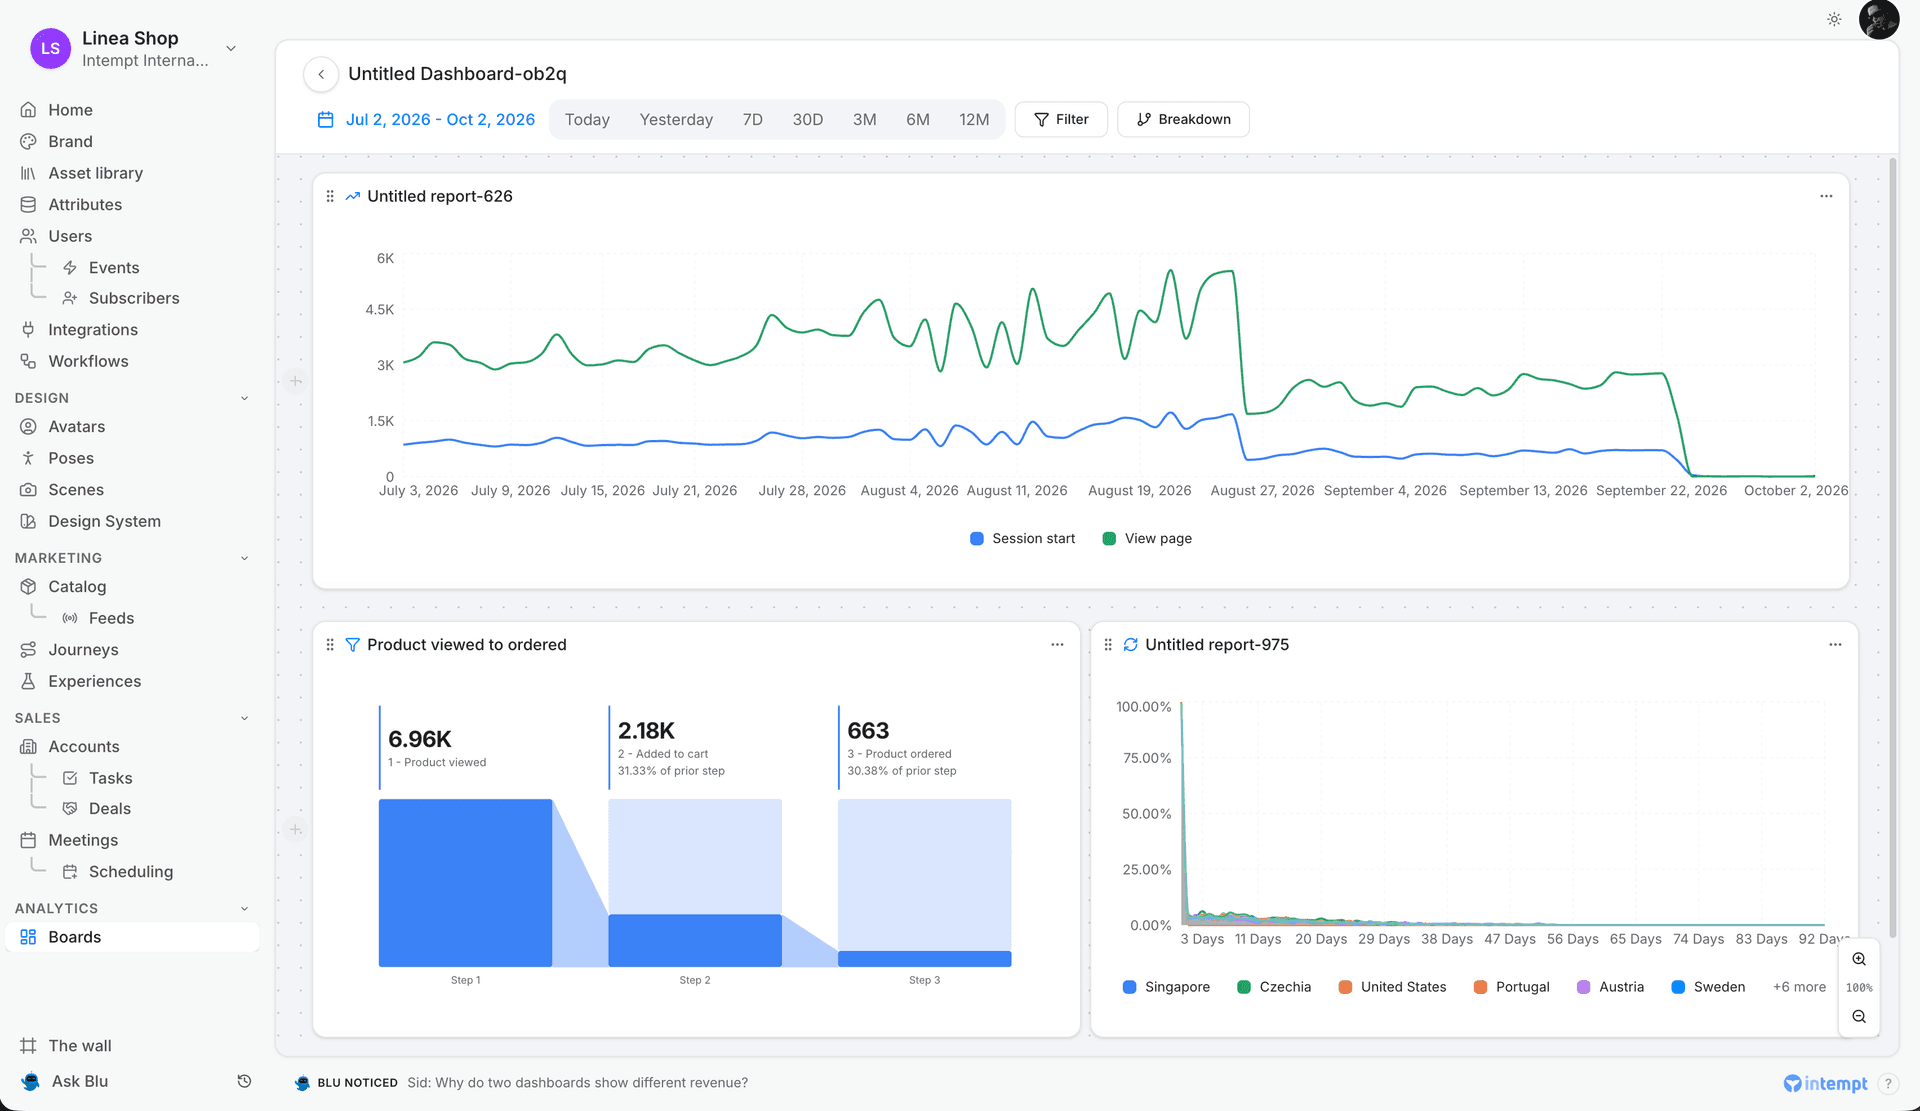
Widgets sit in rows. Drag a card by its grip handle to reorder it within a row or move it to another row, drag the divider between two cards to resize them, and drag a row's bottom edge to change its height. Hover between two rows to insert a new row, and use the zoom controls in the bottom-right corner to zoom the whole board from 50% to 200%.
Editing a widget
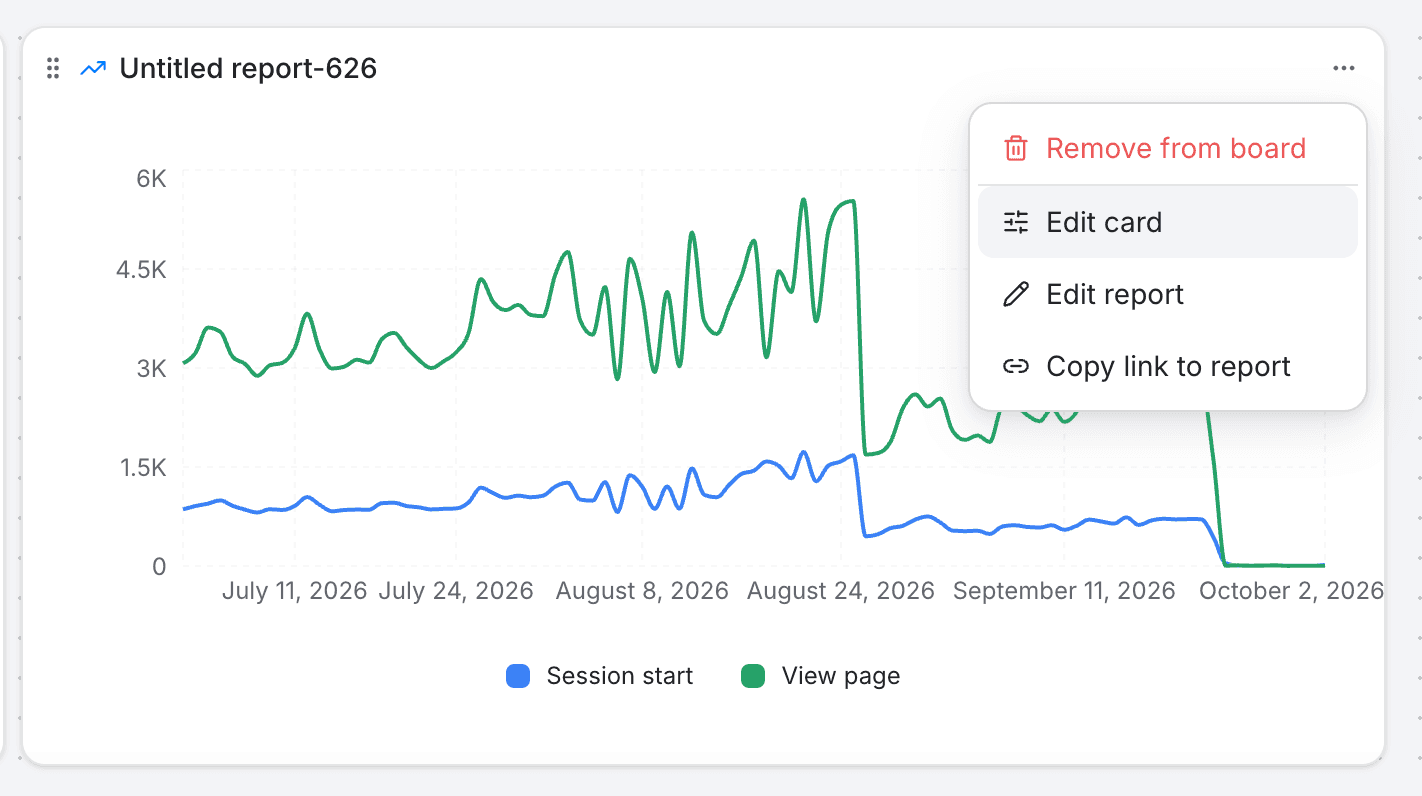
Hover a card and open its three-dot menu:
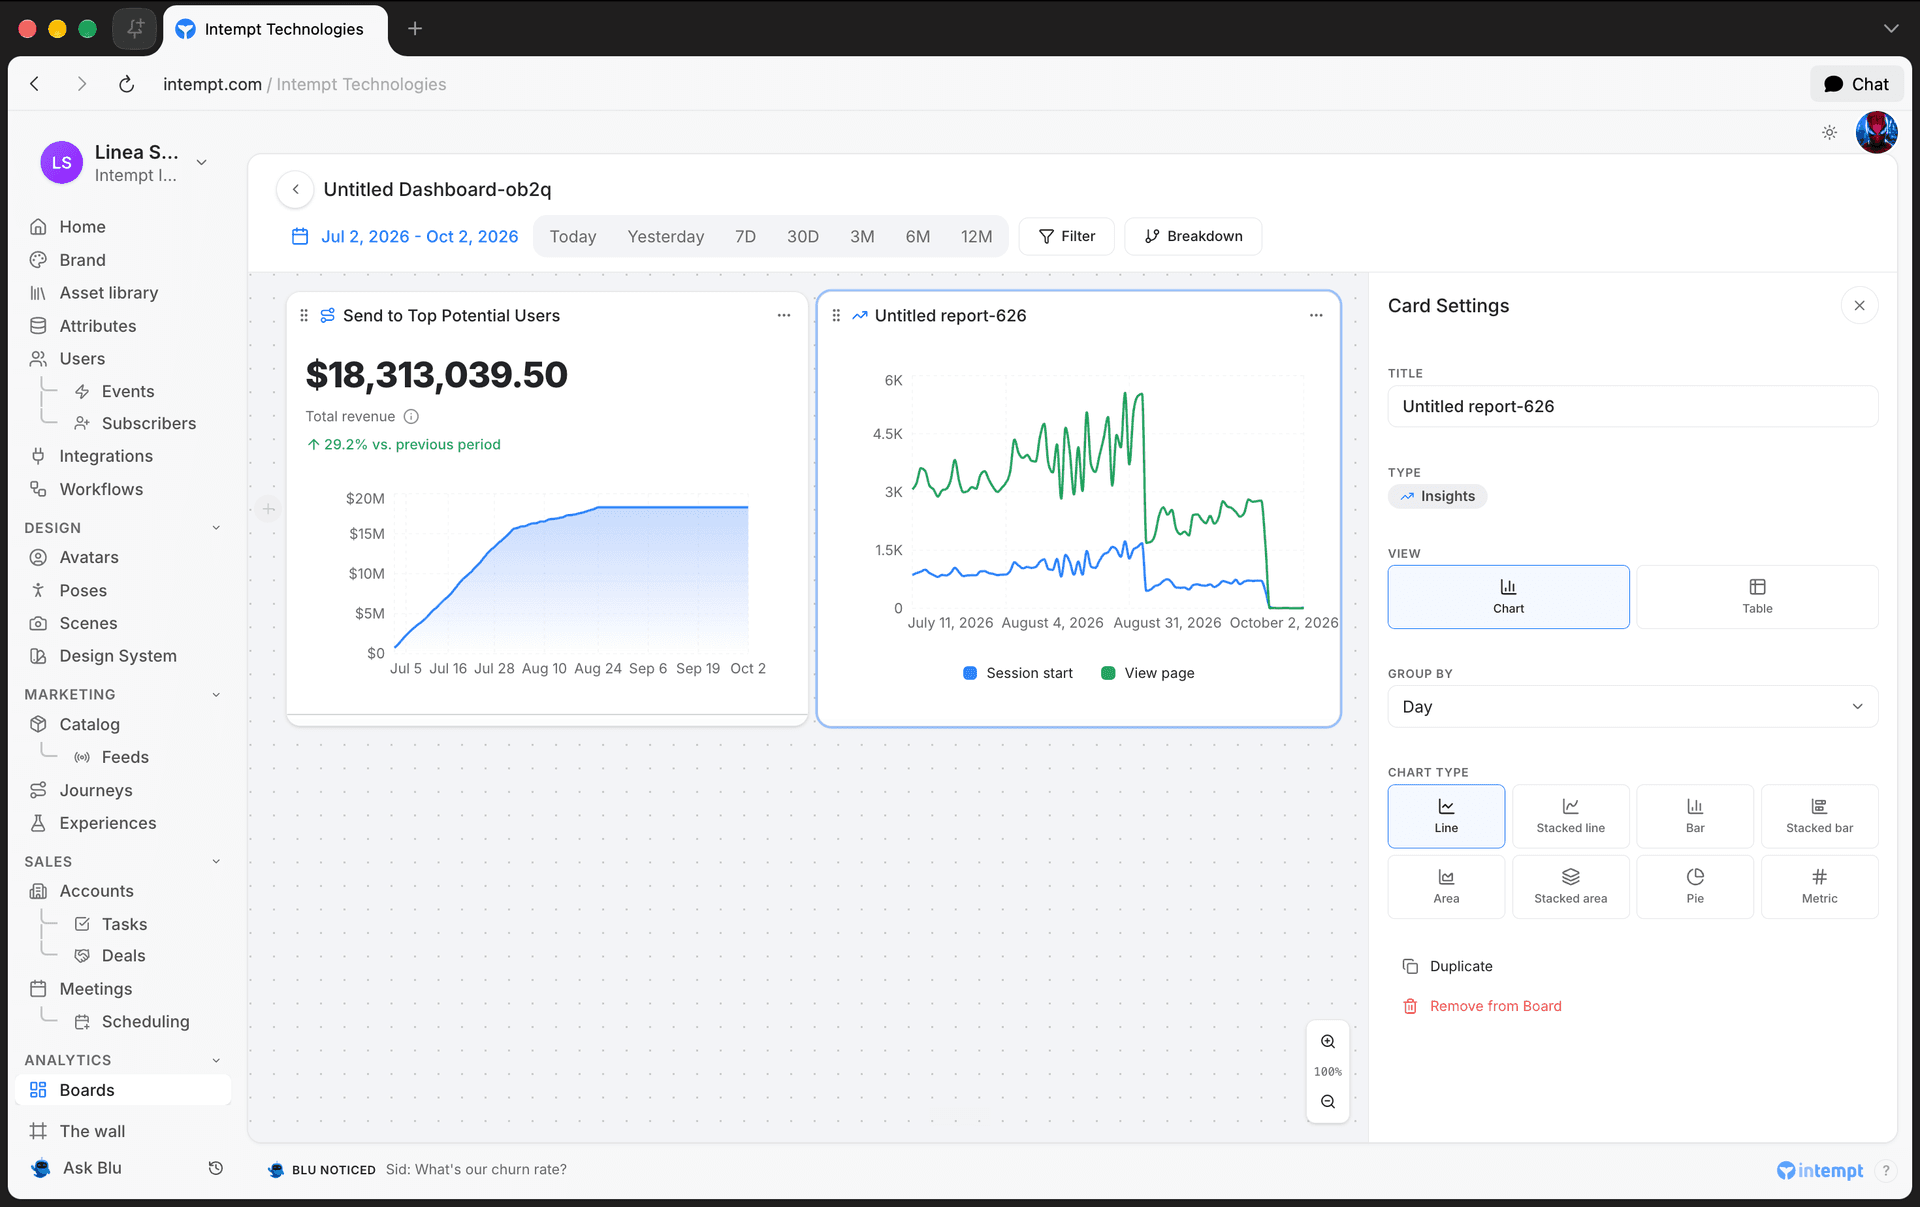
- Edit card opens Card Settings, where you can rename the card's title, switch between Chart and Table view (Insights, Funnels, and Retention cards), change the chart type (options depend on the widget type, for example Insights offers Line, Stacked line, Bar, Stacked bar, Area, Stacked area, Pie, and Metric, while Funnels offers Funnel, Line, Trends, and Metric), and set Group By (Insights cards only).
- Edit report (or Edit journey / Edit experience for those widget types) opens the item at its source, to change what it actually measures, its events, filters, or retention settings, instead of just how it displays here.
- Copy link to report copies a direct link to the underlying report.
- Remove from board removes the card from this dashboard without touching the underlying report.
💡 Good to know
Card Settings only change how a widget displays on this dashboard, not what the report actually measures. That's what Edit report (or Edit journey / Edit experience) is for.
Setting the dashboard's timeframe
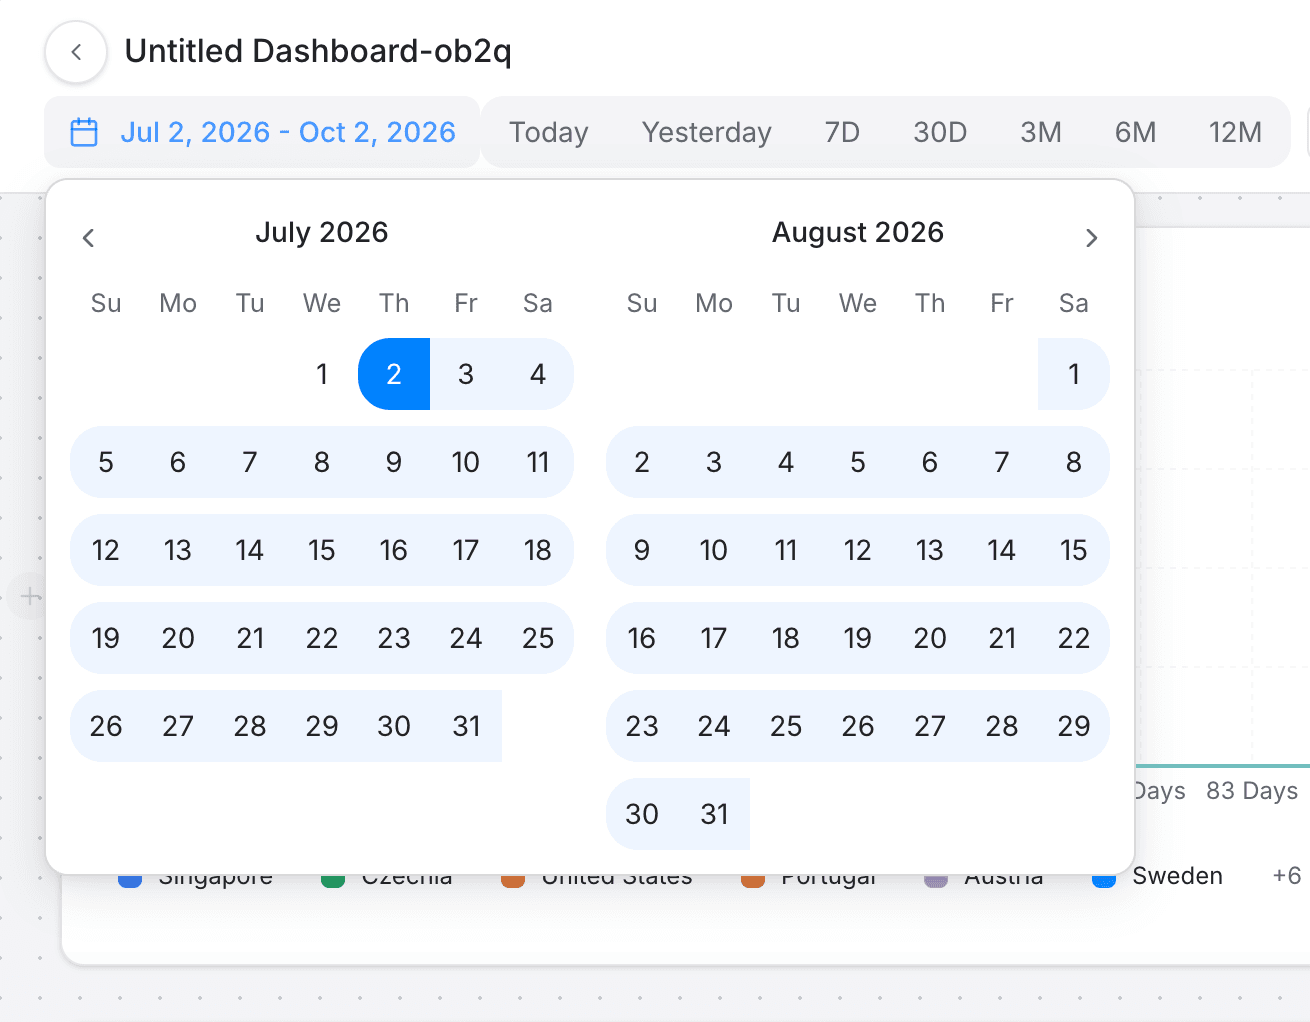
At the top of the dashboard, set the title, then a date range that applies to every widget on the board. Filter and Breakdown controls next to it apply on top of that shared date range.
| Range | Meaning |
|---|---|
| Custom | A specific range you choose, for example May 1 - May 31. |
| Today | The current, incomplete day up to the current second. |
| Yesterday | The whole of the previous day, midnight to midnight. |
| 7D / 30D | The last 7 or 30 days plus the current incomplete day. |
| 3M / 6M / 12M | The last 3, 6, or 12 months plus the current incomplete day. |
Changes save automatically as you edit.
Use cases
- KPI monitoring. Add your key reports to a dashboard, set a shared date range, and check it regularly instead of rebuilding the same charts.
- Experiment results monitoring. Add an experience's results to a dashboard to track its performance alongside the rest of your metrics.
- A team standup view. Put your onboarding funnel, weekly retention, and activation trend on one board so the whole team reads the same numbers.
Where to go next
- Analytics for what reports and dashboards do and which report type to reach for.
- Creating an insights report, Creating a funnel report, and Creating a retention report to build the reports you'll add here.
Creating a retention report
Retention reports show how many users return and repeat an event after their first interaction, grouped by day, week, or month.
Subscription analytics
The Subscription board tracks your organization's own subscription revenue: MRR, subscriber counts, churn, plan mix, and trial conversion, synced from Stripe.