
Journey analytics
Journey analytics allow you to analyze the performance of your journey.
Overview
Journey analytics allow you to analyze the performance of your journey.
Sections overview
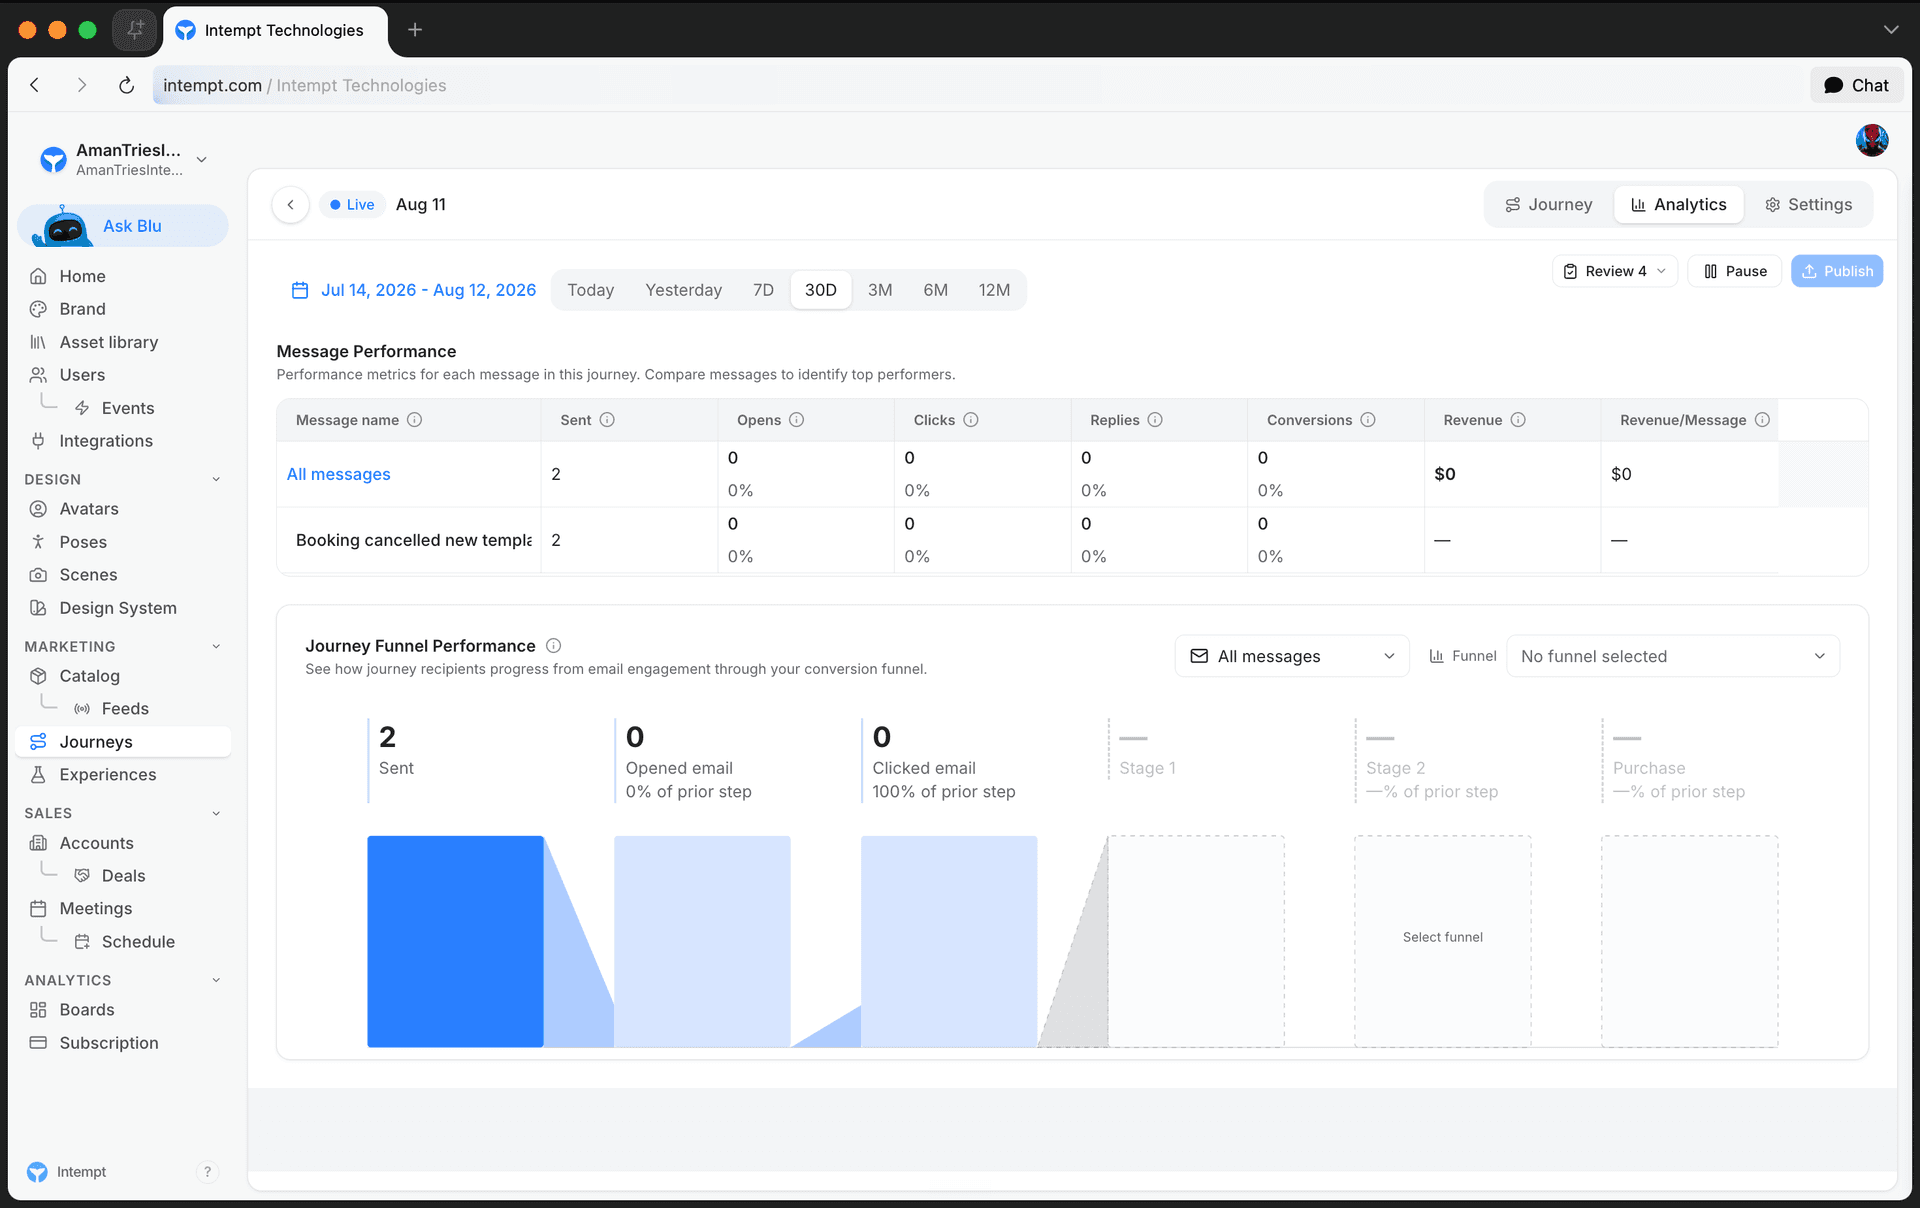
The Analytics tab has two parts: a message performance table that breaks down engagement and revenue per message, and a Journey Funnel Performance chart that connects email engagement to a conversion funnel you pick. Both respect the date range you set at the top of the tab.
Metrics
The following sections explain each part of the Analytics tab.
1. Date range
The date range at the top of the tab sets the window for both the message table and the funnel chart below it.
All dates and times in Intempt reflect the project time zone.
| Tab value | Meaning | Description |
|---|---|---|
| Custom | Custom | Opens a calendar to pick a specific date range. |
| Today | Today | Includes the current incomplete day up to the current second. |
| Yesterday | Yesterday | Includes the whole of the previous day from midnight to midnight. |
| 7D | Last 7 days | Last 7 days and the query count from the current incomplete day up to the current second. |
| 30D | Last 30 days | Last 30 days and the query count from the current incomplete day up to the current second. |
| 3M | Last 3 months | Last 3 months and the query count from the current incomplete day up to the current second. |
| 6M | Last 6 months | Last 6 months and the query count from the current incomplete day up to the current second. |
| 12M | Last 12 months | Last 12 months and the query count from the current incomplete day up to the current second. |
2. Message performance table
Below the date range, the message performance table lists every message sent in the journey, plus an aggregated "All messages" row.
| Column | Shows |
|---|---|
| Message name | The message's channel icon and title. "All messages" aggregates every message in the journey. |
| Sent | Total sends for that message. |
| Opens | Unique opens and the open rate. Shows a dash for channels without open tracking, like SMS. |
| Clicks | Unique link clicks and the click-through rate. |
| Replies | Direct replies to that message. Shows a dash if replies don't apply to the channel. |
| Conversions | Purchases attributed to that message under Intempt's 5-day attribution model: a user clicks or opens the message, then purchases within 5 days. |
| Revenue | Total revenue attributed to that message. |
| Revenue/Message | Revenue efficiency of that message. Compare across messages to identify top performers. |
📘 Good to know
Hover the info icon next to any column header for its exact definition, the same text as the table above.
3. Message selector
Pick which message's engagement, or "All messages," feeds the email-engagement side of the chart.
4. Funnel selector
Pick which of your saved funnels supplies the conversion steps. If you don't select one, the chart shows placeholder bars labeled Stage 1, Stage 2, and Purchase with a "Select funnel" prompt instead of real conversion data.
5. Email engagement summary cards
Sent, Opened, and Clicked for the selected message.
6. Selected funnel summary cards
The conversion steps of the funnel you picked, for example Added to cart and Placed order. Each card shows the step's value and, for every step after the first, its percentage of the prior step.
7. Waterfall chart
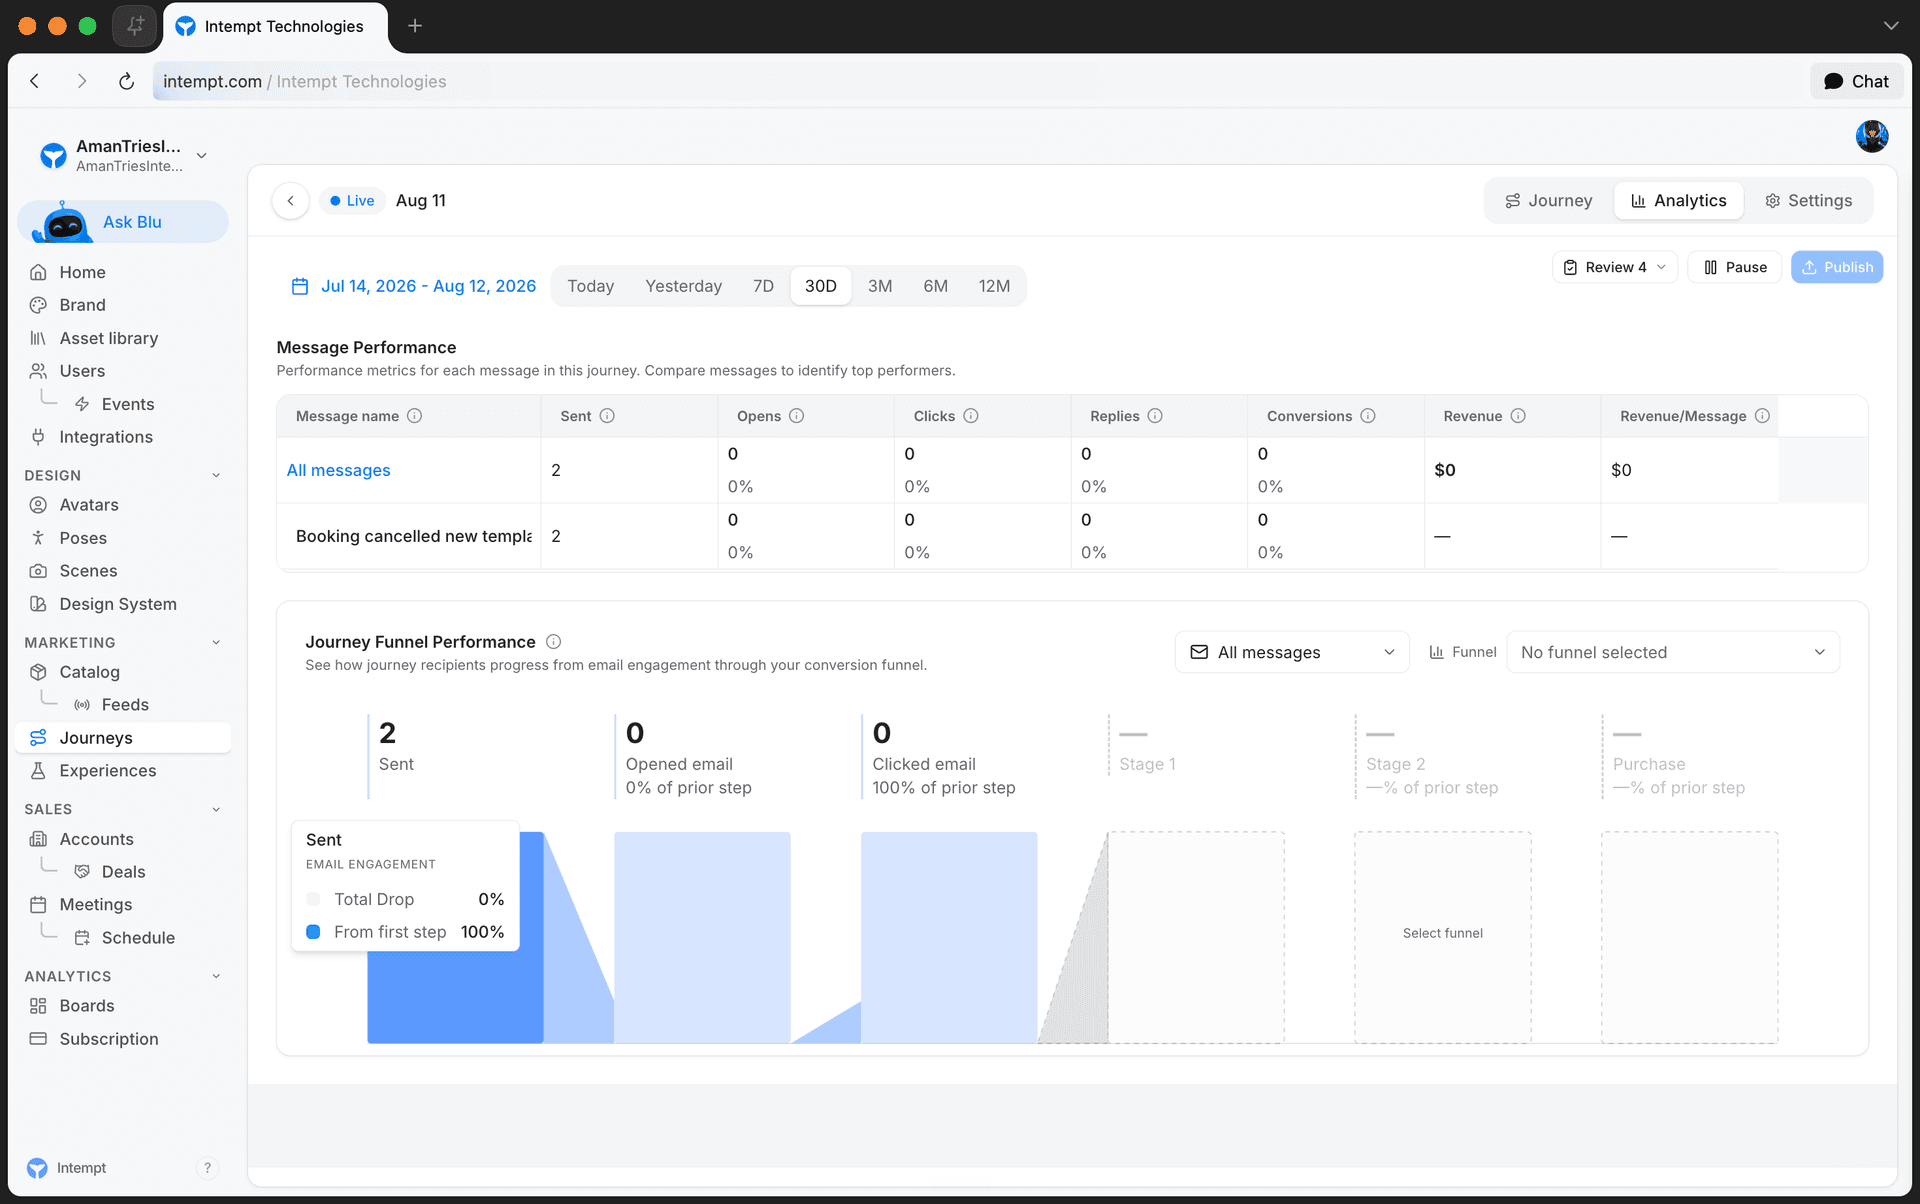
The chart connects every step, the three fixed email-engagement steps followed by your funnel's conversion steps, as a single sequence of bars. Hover a bar to see:
-
Total Drop. The percentage lost since the first step.
-
From first step. The percentage of the first step's volume that reached this step.
Where to go next
Deliverability
Deliverability is a global configuration setting in Journeys that controls when and how often your messages are delivered. It ensures that your campaigns respect sending limits, timing restrictions...
Journey blocks
Triggers define the conditions that users need to meet to enter the journey.