
Viewing Analytics & Dashboards on Mobile
Check your Traffic, Revenue, and Engagement dashboards, then browse your saved Dashboards and Reports from the Intempt mobile app.
Overview
The mobile app gives you a read view of your project's analytics: the same Traffic, Revenue, and Engagement dashboards you see on Home, plus every saved Dashboard and Report your team has built. This guide covers switching between the Home dashboards, opening a saved Dashboard's reports, and browsing the full Reports list.
Quick dashboards on Home
With Analytics selected as your product on Home, a dashboard selector card sits below the header. Tap it to open a sheet listing three dashboards:
- Traffic. Sources, pages, geography, devices.
- Revenue. Product catalog, categories, verticals.
- Engagement. Activity, stickiness, retention, sessions.
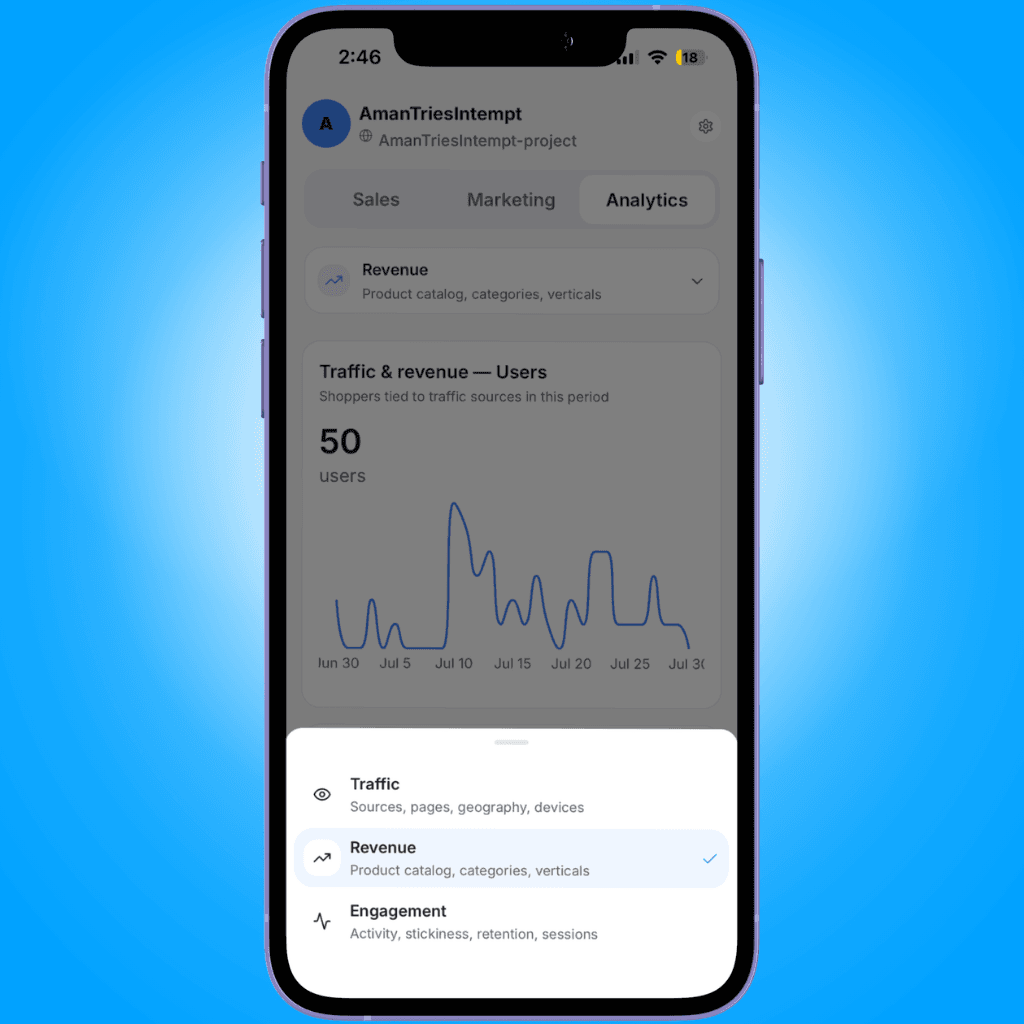
Selecting one replaces the charts on Home with that dashboard's cards. The Traffic dashboard, for example, shows visitors and revenue broken down by UTM campaign, by device/OS/browser, by location, and by page, each with tabs to switch dimensions. Charts that fail to load show a retry option instead of the chart.
Opening the full Dashboards list
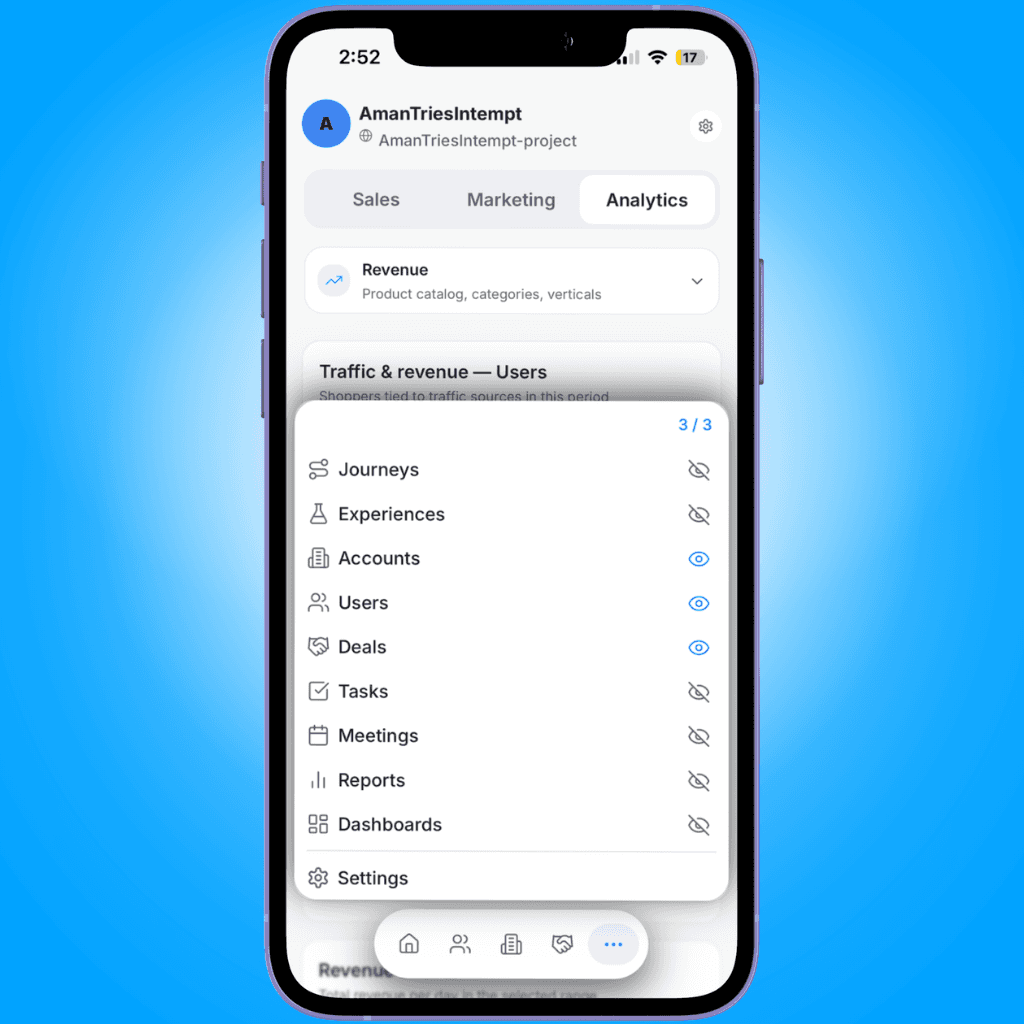
From Home, tap ••• in the bottom tab bar, then tap Dashboards.
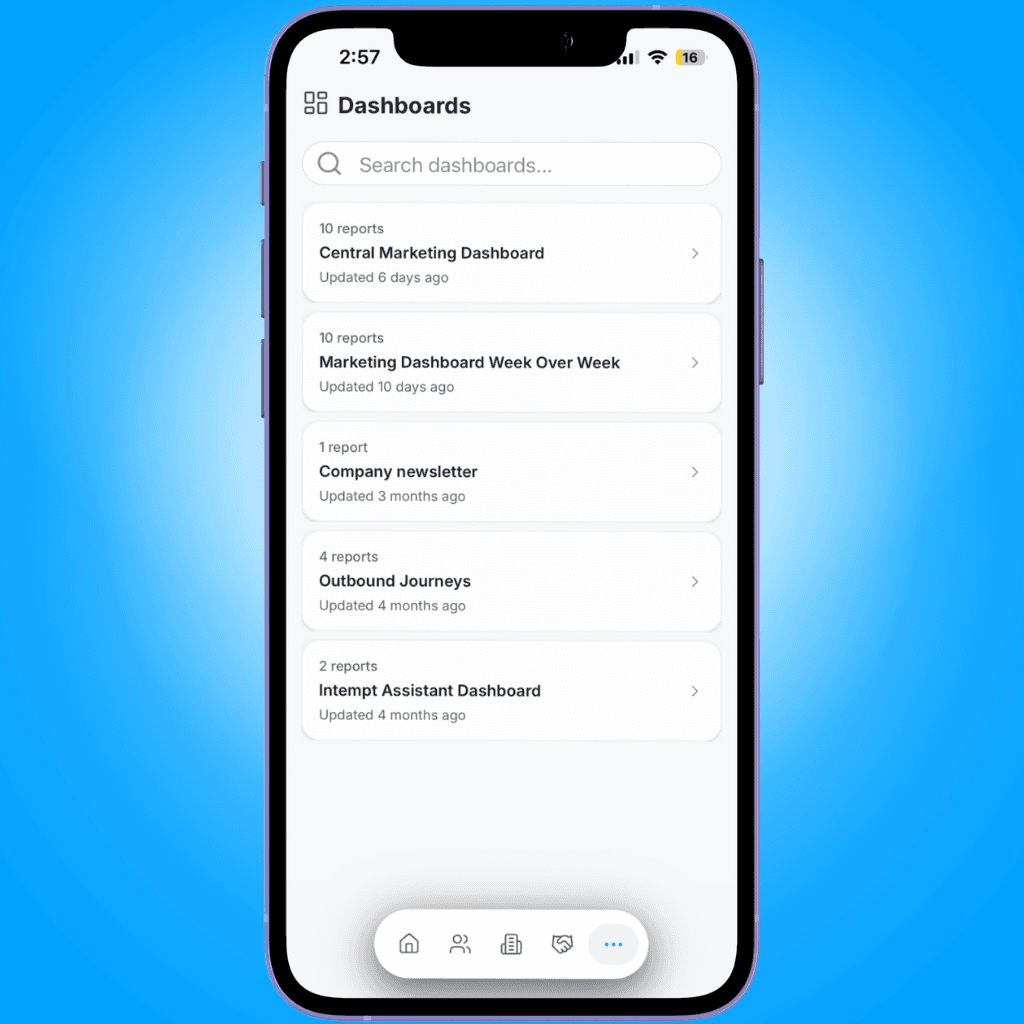
The Dashboards screen lists every saved dashboard as a card showing its report count and when it was last updated. Use the search bar above the list to filter by name. If you haven't created any dashboards yet, the screen shows "No dashboards found."
To rename or delete a dashboard, swipe a card left to reveal a rename action or right to reveal delete, or long-press the card to open the same two actions in a menu. Deleting asks you to confirm first.
Viewing a dashboard's reports
Tap any dashboard to open it. The detail screen shows a "Contains N reports" card with when the dashboard was last updated, followed by a list of the reports it contains. Each report card shows an icon for its type (Insights, Funnel, Retention, or Journey) along with its name.
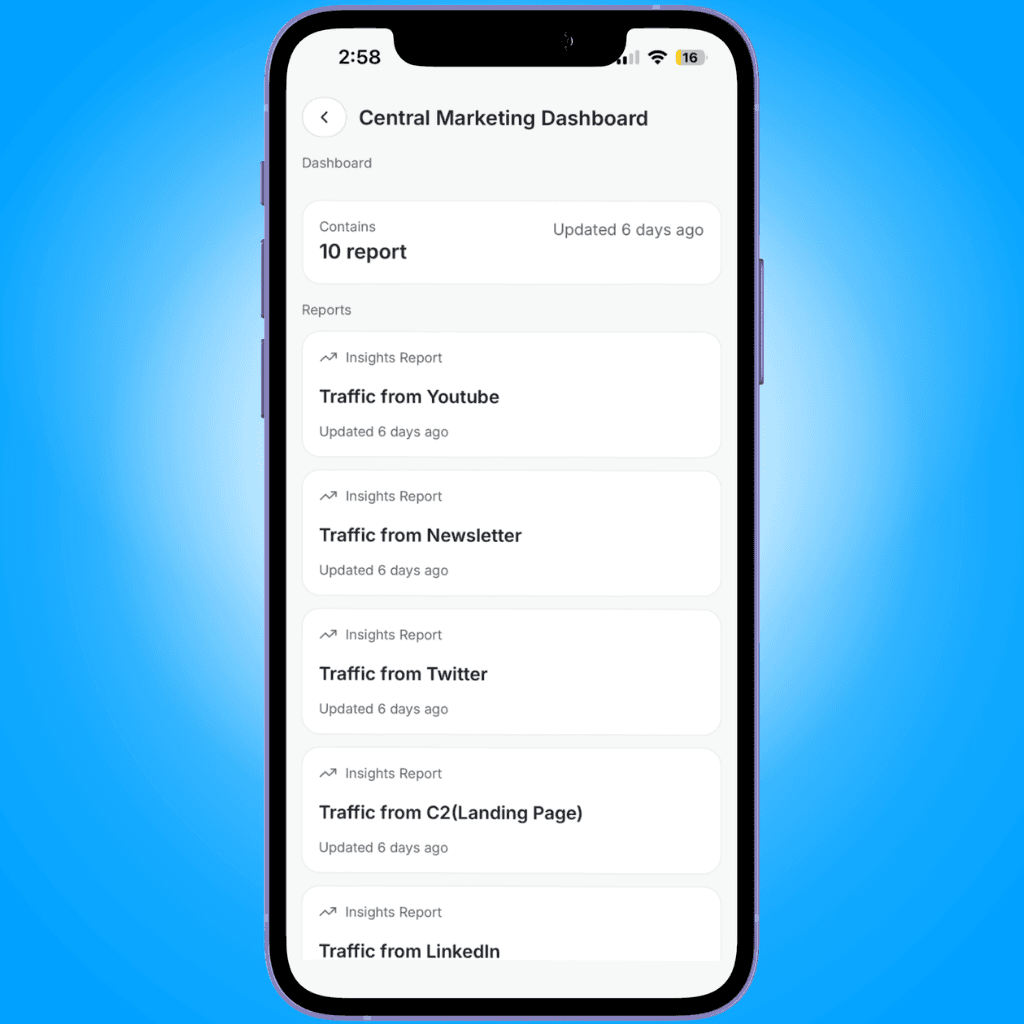
Tap a report card to open a full-screen view of its content:
- Insights. A stat table (dataset, total, average, and percent of total) followed by a line or bar chart.
- Funnel. An overall conversion rate card, a step-by-step funnel chart, and a drop-off analysis list showing how many users were lost between each step.
- Retention. A summary of the start and return events, key retention metrics, an average retention curve, and a cohort retention grid with a color legend.
- Journey. A performance line chart, a channel delivery breakdown you can switch between All, Email, SMS, Slack, and Push, and a per-message breakdown below it.
If a dashboard has no reports yet, it shows "No reports yet" with a prompt to add some.
Opening the full Reports list
From •••, tap Reports instead. The Reports screen groups every report you have access to by type: Insights, Funnels, Retention, Lists, and Catalogs, each section showing its report count. Use the search bar above the list to filter by name.
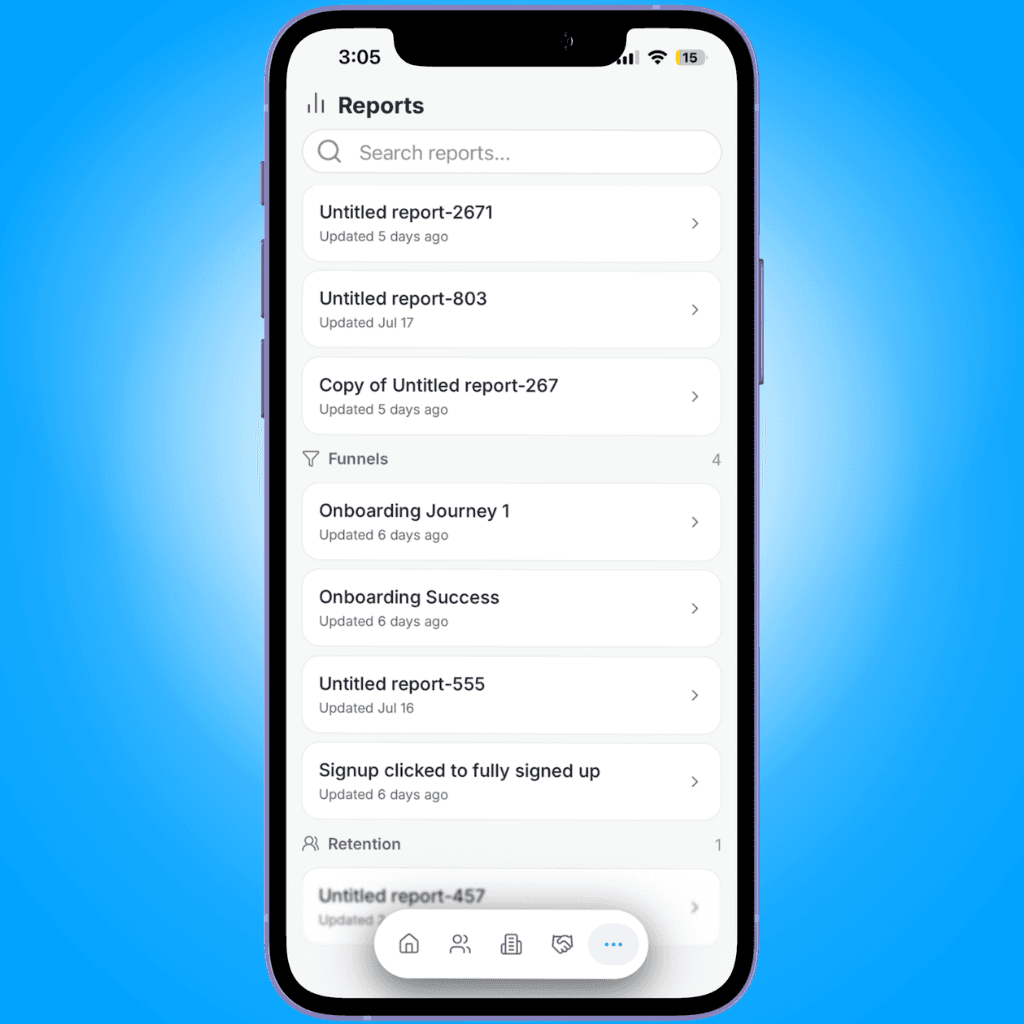
Reading a report's detail
Tap any report to open its full-screen detail view. The header shows the report's name and type. Insights, Funnel, and Retention reports render the same content described above. Other report types show a placeholder note that the data will be displayed there.
To rename, duplicate, or delete a report, swipe a card left for rename or right for delete, or long-press it to open all three actions (rename, duplicate, delete) in a menu.
Refreshing and loading more
Pull down on any list (Dashboards, Reports, or a dashboard's report list) to refresh it. Scrolling to the bottom of a long list loads the next page automatically.
Where to go next
- Dashboards - the full concept and how to build and manage dashboards from the web console.
- Analytics - the full concept behind Insights, Funnel, and Retention reports.
- Creating an Insights report
- Creating a Funnel report
- Creating a Retention report
Viewing Journeys on Mobile
Browse, filter, and open journeys from the Intempt mobile app, check their status, and start, pause, resume or stop them on the go.
Viewing Experiences on Mobile
Browse, filter, and open experiments and personalizations from the Intempt mobile app, and control their status while you're away from your desk.