
Monitoring workflow runs
The Runs tab: filters, the stats strip, the Rows and Lineage views, bulk replays and cancels, and the run detail panel with its run graph and per-step payloads.
Overview
A run is one execution of a workflow. A workflow with an event trigger produces one run per matching record; a workflow with a scheduled trigger produces one run per fire.
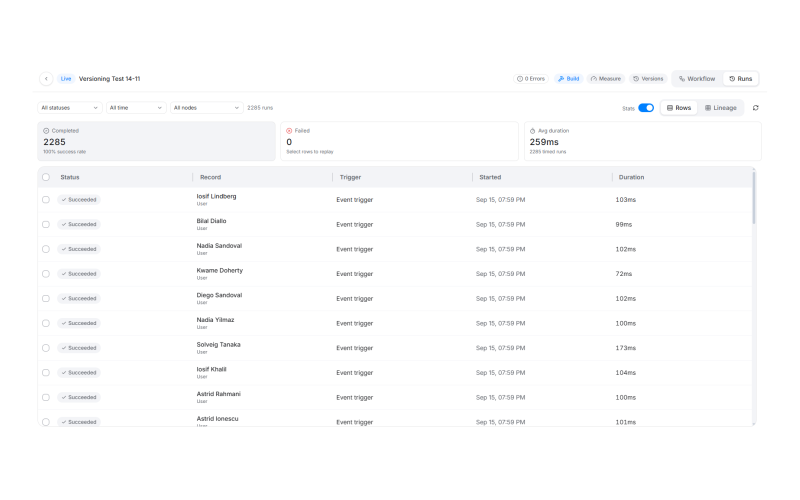
Click Runs in the workflow header to open the Runs tab. It has three bands stacked down the page: a control header, a stats strip, and a view of the runs themselves. Filters and selection are shared across all three, so switching views keeps what you narrowed down to.
The control header
Filters
Three filters sit on the left, followed by the run count.
Status - defaults to All statuses. The full vocabulary:
| Status | What it means |
|---|---|
| Succeeded | The run completed. |
| Failed | A step reported an error and the run stopped. |
| Running | The run is executing now. |
| Waiting | The run is parked before it reached the point it would resume from. |
| Paused | The run was held by a workflow pause. |
| Queued | The run is accepted but has not started. |
| Cancelled | Someone stopped the run. |
| Timed out | The run was held long enough that it expired. |
| Held for review | The run is open and parked for a human decision. |
Time range - All time (the default), Last 24 hours, Last 7 days or Last 30 days.
Node - All nodes by default, or one node of this workflow. The options are the workflow's real nodes, named as they are on the canvas.
Run count - reads "10 runs" and reflects the filters you have applied.
View controls
Four controls sit on the right:
- Stats - a switch that shows or hides the stats strip. Turn it off to get the vertical space back while debugging.
- Rows / Lineage - the two ways of reading the same filtered set of runs.
- Refresh - re-fetches the runs.
The stats strip
Three cards sit under the filters. They describe the filtered population, not just the page of runs you can see.
| Card | Value | Subtitle |
|---|---|---|
| Completed | How many runs succeeded | "90% success rate" |
| Failed | How many runs failed | "Select rows to replay" |
| Avg duration | The mean duration | "10 timed runs" |
Completed and Failed are clickable. Clicking one narrows the run population to that status, and clicking the active one clears back to every status.
The Rows view
Rows answers the question "which run failed". One row per run.
| Column | What it shows |
|---|---|
| Status | The run's status badge. A failed run shows its error message underneath, truncated. |
| Record | The record this run was about, with its type underneath: Contact, Account, User or Journey. A run with no record resolves to "Unknown". |
| Trigger | What started this run. |
| Started | When the run started. |
| Duration | Time from start to finish. Blank while the run is still open. |
Rows load in pages of 50 and fetch more as you scroll. The empty state reads "No runs match these filters."
Selecting runs
Each row has a checkbox, and the header has a select-all that selects every row currently loaded. When the filtered population is larger than what is loaded, a Select all N matching link appears, which extends the selection to every matching run including ones not yet fetched.
Clicking a row opens the run detail panel on the right. Clicking the same row again closes it.
The Lineage view
Lineage answers a different question: "which node is failing". It pivots the same filtered runs sideways. Runs go down the left, the workflow's nodes go across the top, and each cell is what that run did at that node.
The Run column and the checkbox column are pinned, so scrolling right to reach a later node never leaves you with a grid of cells and nothing saying which run each row is.
Cell states
| Cell | Meaning |
|---|---|
| Completed | The run passed through this node successfully. |
| Failed | The run failed at this node. |
| Running | The run is executing this node now. |
| Held for review | The run is parked at this node. |
| Never reached | The run stopped before it got here. |
| Not in this version | The node did not exist in the version this run executed. |
Column headers
Each node's column header carries the node's name and an aggregate underneath, for example "88% of 10 succeeded", so you can see which node is the problem before opening anything.
Choosing what a column shows
Each column has a Show picker with three options:
- Status only - the default. The cell shows the status word.
- Output attributes - the exact recorded value at a path inside that node execution's output.
- Input attributes - the same, for its input.
This is per column, so you can leave most columns on status and pull one field out of the node you are investigating.
Clicking any cell opens the run detail panel for that run, the same panel the Rows view opens.
Bulk actions
Selecting one or more runs in either view opens an action bar showing how many are selected and how many of those failed. It offers three actions:
| Action | Which runs it applies to |
|---|---|
| Replay from start | Succeeded, Failed, Cancelled and Timed out runs, plus Waiting runs |
| Replay from failed step | Failed runs only |
| Cancel | Queued, Running, Waiting, Paused and Held for review runs |
Each button acts on the eligible subset of your selection and shows that count, so a button never fires against runs it cannot apply to. Clear selection empties the selection.
Cancelling
Cancel asks first, because it is final: "The run stops where it is and cannot be resumed. Replaying it later starts a new run from the beginning."
Cancelling every matching run, rather than a loaded selection, says so explicitly: "Every run matching the current filters stops where it is and cannot be resumed, including runs not loaded in the table."
Confirm with Cancel run, or dismiss with Keep running.
Replaying from start
Replay from start opens a dialog before it fires. It re-executes the whole workflow from the recorded trigger output, and it shows you:
- Trigger, Record and Runs - what is being replayed.
- Version - which published version to replay against. The default is "Same as original", and you can pick any published version or Current instead.
- Steps to execute - the steps that version will run, with a count like "4 of 6". Steps that may create something twice are flagged "may duplicate".
When you replay several runs at their own original versions, the step list cannot be shown, because each run replays at a different version. The dialog says so: "Each run replays at the version it originally ran, so the steps differ per run. Pick a version above to see them."
📘 Good to know
Replaying against a chosen version is what makes the repair loop work: a run fails, you fix the graph, you publish a new version, and you replay the failed runs against it.
Run detail
Clicking a run in either view opens a docked panel on the right. It has three parts.
Header
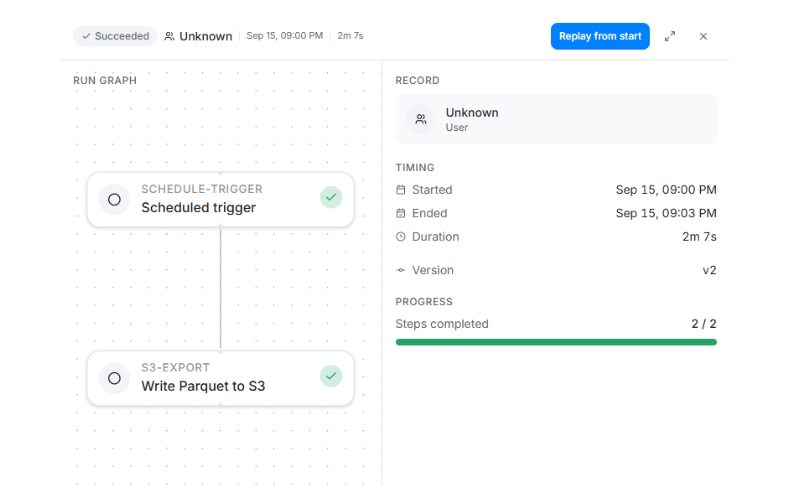
The run's record, status badge, when it started and how long it took, plus the actions available for that run: Replay from start, Replay from failed step and Cancel, each shown only when the run's status allows it. The panel's own expand and close controls sit alongside them.
If the run failed, a Failure block runs across the full width underneath, naming the node it failed at, for example "Failed at Write Parquet to S3", with the error message and a Copy error message button. A run that failed with nothing recorded reads "No step reported an error, and the run carries no reason."
Run graph
The left column draws this run's walk through the workflow, top to bottom, in the order the run actually executed. It is a real canvas, so you can pan and zoom it.
Each step is a card carrying the node's glyph, its name and type, a status chip, and its duration. Cards are outlined by state: a solid border for a completed step, a red border for a failed one, and a dashed border for a step the run never reached.
The canvas can branch; a run's walk through it, on any one execution, is still a straight line.
Summary
The right column shows:
- Record - what the run was about, with an Open record button for record types that have a detail page in the console.
- Timing - when the run started and, for a finished run, when it ended.
- Progress - steps completed.
Step detail
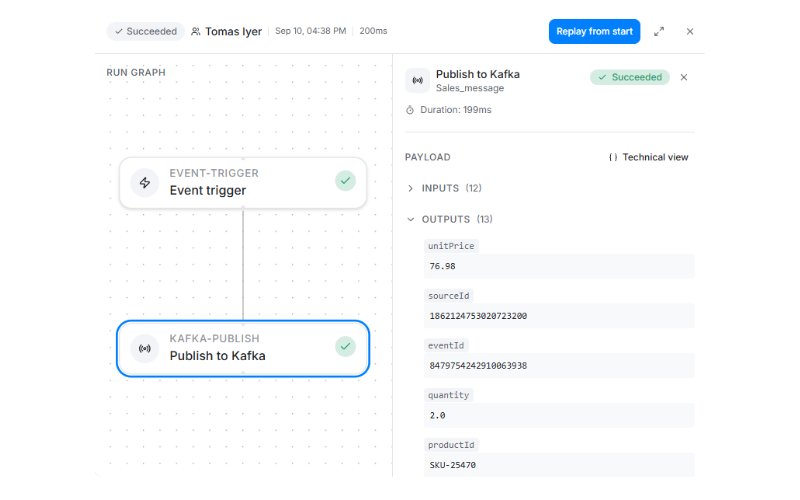
Clicking a card in the run graph replaces the summary column with that step's detail:
- Its status, using the same words the Rows table uses.
- Its timing: Duration for a finished step, Currently running and "In progress for 4.2s" for an open one.
- Errors, when the step reported any, with the same copy button.
- Input and Output payloads. These are shown in a Readable view by default and a Technical view for the raw payload. A step that has not finished shows "Outputs will appear when the step completes"; a step the run is parked at shows "Run is waiting at this step."
Close the step detail to go back to the run summary.
Where to go next
- The workflow builder - the Measure surface, which puts per-node run metrics on the canvas itself.
- Publishing and versions - which version a run executed, and how rollback affects runs in flight.
- Adding nodes - the nodes whose behaviour these runs record.