
The workflow builder
The workflow canvas, its header bar, the Build and Measure surfaces, the node toolbar, the zoom controls and every canvas gesture.
Overview
Opening a workflow from the list takes you to the builder. It is one page with two tabs, Workflow and Runs, and the Workflow tab has two surfaces, Build and Measure.
Everything you do on the canvas saves as you do it. There is no Save button: moving a node, connecting two nodes, editing a node's config or deleting a node is written through immediately. Saving is not the same thing as publishing, which is covered in Publishing and versions.
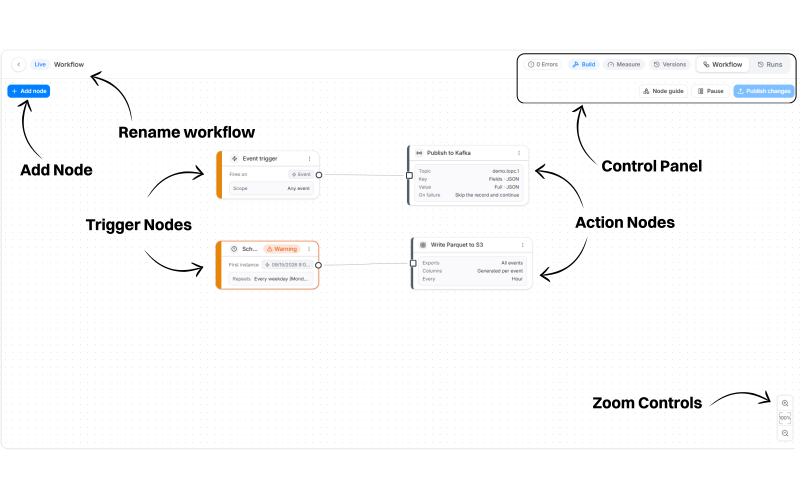
The header bar
The header runs across the top of the page. Left to right:
Left side
- Back arrow - returns to the workflow list. It always goes to the list, not to the previous page.
- Status badge - Draft, Live, Paused, Stopped or Scheduled.
- Workflow name - click it to rename in place. The name must be unique across your journeys and workflows; if it is taken you see "That name is already taken" and the old name comes back. Maximum 200 characters, and it cannot be empty.
- Draft pill - appears only when unpublished edits exist over a published version. It reads Editing draft when the canvas is showing those edits, and Unpublished changes when the canvas is showing the published graph instead.
Right side
- Errors chip - a live count of node errors on the canvas, for example "0 Errors". It is a read-only indicator, not a button. While it is above zero, publishing is blocked.
- Build and Measure - the two canvas surfaces. These chips appear only once the workflow is past draft, because a draft has no run history to measure.
- Versions - opens the version history panel on the right.
- Workflow | Runs - the tab switch. Workflow is the canvas; Runs is the execution history.
📘 Good to know
The Errors chip is not hidden on drafts, unlike the Build and Measure chips. Errors matter most while you are still building, so the count is always on screen.
The Build surface
Build is the default surface and the one you edit on.
Add node
The Add node button sits in the top-left corner of the canvas. Clicking it opens the node picker anchored under the button. Right-clicking anywhere on empty canvas opens the same picker at your cursor. See Adding nodes.
The toolbar
The top-right corner of the canvas holds, in order:
- Node guide - a reference panel explaining what each node shape and colour means.
- Discard changes - appears only when an unpublished draft sits over a published version. It deletes the draft and puts the published graph back on the canvas. You are asked to confirm first, and it cannot be undone.
- Pause / Resume - appears only on a workflow that is active, paused or stopped.
- Publish / Publish changes - the label depends on whether the workflow already has a live version.
Pause, Resume, Discard and Publish are all covered in Publishing and versions.
Zoom controls
The zoom cluster sits in the bottom-right corner of the canvas. It has three buttons stacked vertically:
| Control | What it does |
|---|---|
| Zoom in (magnifier with +) | Steps the zoom level up |
| Percentage (the middle button) | Shows the current zoom level, for example "87%". Click it to fit the whole graph into view |
| Zoom out (magnifier with -) | Steps the zoom level down |
You can also zoom with your scroll wheel or trackpad, and pan by dragging empty canvas. The minimum zoom is 10%, so a large graph can be scaled right down to see its shape.
Working on the canvas
Connecting nodes
Every node draws its ports on its left and right edges. Drag from a source port on one node to a target port on another to connect them. While you drag, ports that cannot accept the connection are greyed out, so an invalid wire is refused before you release rather than after. Dropping within about 30 pixels of a port snaps to it, which keeps ports reachable at the zoom levels a large graph is actually read at.
Two shapes deliberately have fewer ports:
- A trigger draws an output only. Nothing connects into a trigger.
- A terminal node draws an input only. Nothing continues after it.
Moving and deleting
Drag a node to move it. Positions save when you release, not while you drag. Select a node and press Backspace to delete it. Deleting a node in the middle of a chain rewires the nodes around it.
The node menu
Every node card has a ⋯ menu in its top-right corner with three items:
- Configure - opens the node's configuration panel on the right.
- Duplicate - creates a copy of the node with its configuration.
- Delete - removes the node.
The right-click menu
Right-clicking a node opens a second menu with five items:
- Download - not yet available.
- Clear - not yet available.
- Duplicate - the same action as the ⋯ menu.
- Lock / Unlock - locks the node in place so it cannot be dragged. The label always names the action it is about to take.
- Delete - the same action as the ⋯ menu.
📘 Good to know
Lock applies to your current session only. It is a canvas convenience, not a workflow setting, so it does not survive a page reload and is not part of what gets published.
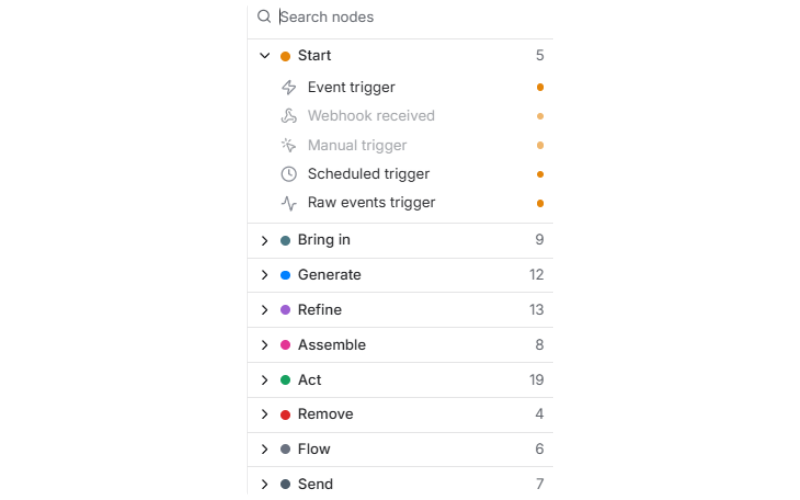
Reading a node card
Each node card carries, from the top:
- A coloured left rail showing which family the node belongs to.
- A glyph and the node's name. If you renamed it, the original node type shows underneath as a smaller sub-label.
- A ⋯ menu.
- A summary body with one row per important setting, for example "Exports: 3 events", "Table: aman_s3_iceberg", "Columns: 6 mapped", "Every: 15 minutes". A setting you have not filled in yet reads as an italic Not set.
If the node's configuration has a problem, a pill appears in its header:
| Pill | Meaning |
|---|---|
| Error | The node's config is invalid. Publishing is blocked until it is fixed. |
| Misconfigured | The node is missing a required setting. |
| Warning | The node will publish, but something about it is worth knowing. |
| Publishable, but costly | The node will publish, and the configuration will cost more than it needs to. |
A warning never blocks publishing. Only errors do.
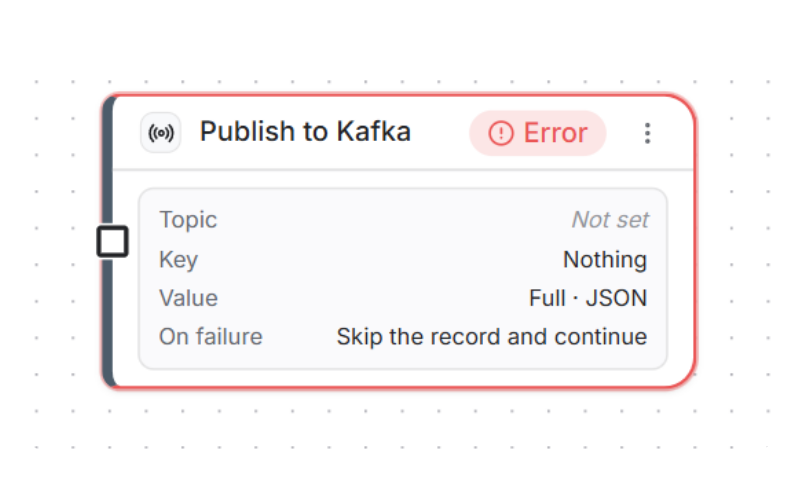
Configuring a node
Click Configure on a node's ⋯ menu to open its configuration panel on the right of the screen. What the panel contains depends on the node; see Adding nodes for each available node's settings.
Every panel opens with a line saying what the node does, and a How to use this node toggle that expands to show more. Two rows are always there:
- Data in - what connects into the node.
- Before it runs - what has to be true first.
Two more appear where they apply:
- Data out - what the node passes on. Terminal nodes such as Publish to Kafka and Write Parquet to S3 have no Data out row, because nothing continues after them.
- Watch out - a limitation worth reading before the node runs.
Changes in the panel save as you make them, and the node's summary rows on the canvas update to match.
The Measure surface
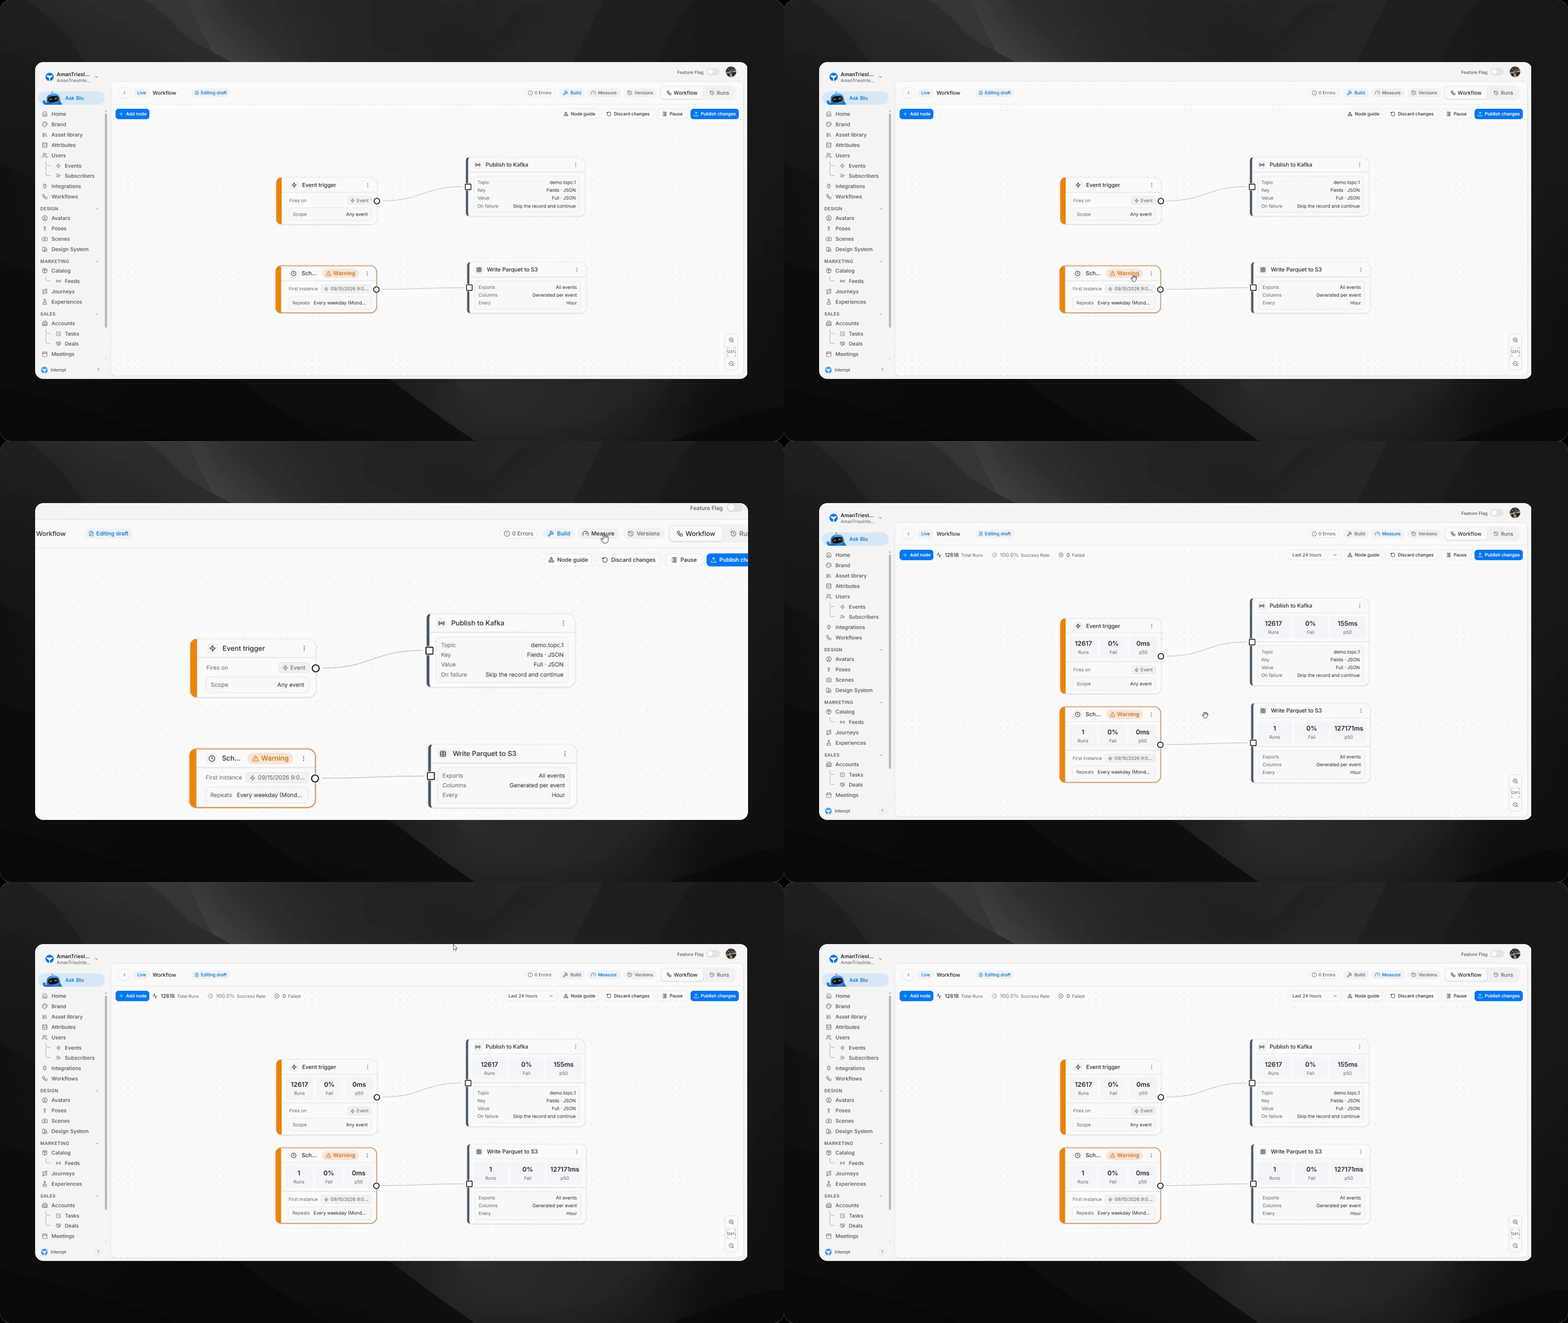
Click Measure in the header to switch the canvas from editing to reading. The graph stays exactly where it is; the chrome around it changes.
Measure adds:
- A time range control in the top-right, before the node guide: Last 24 hours (the default), Last 7 days or Last 30 days.
- Three workflow-level figures in the top-left, next to Add node: Total Runs, Success Rate and Failed. Success rate is colour-coded: green at 95% and above, neutral from 90% to 95%, red below 90%. Failed turns red when it is above zero.
- A three-tile strip on each node card: Runs (distinct runs that touched the node), Fail (the node's failure rate as a percentage) and p50 (its median duration in milliseconds).
A node that has no measurements yet, because it is new or has never executed, draws exactly as it does in Build mode rather than showing empty tiles.
Measure changes what the canvas shows, not what it lets you do. Switch back to Build when you want the editing chrome back.
📘 Good to know
The Measure time range and the Runs tab's time filter are separate controls. Changing one does not change the other, so you can look at the last 24 hours on the canvas while the Runs tab stays on all time.
Where to go next
- Adding nodes - the node picker and the nodes available today.
- Publishing and versions - taking a workflow live and managing its versions.
- Monitoring workflow runs - the Runs tab in full.