
Pipeline Reporting & Forecasting
Use the Deals page's Analytics tab to track value won against forecast, win rate, and pipeline health, filtered by date range and deal owner.
Overview
The Deals page has an Analytics tab alongside Table and Board. It turns your pipeline into a set of performance metrics and charts, filterable by date range and deal owner, so you can see how much you've won against forecast, how fast deals are closing, and where value is sitting across your stages.
How it works
Filters apply to every metric and chart
Two controls at the top of the Analytics tab scope everything below them:
- Date range – Today, Yesterday, 7D, 30D, 3M, 6M, 12M, or a custom range. The tab defaults to the last 30 days.
- Deal owner – narrow every metric and chart to one rep, or leave it on All deal owners.
Five performance metrics
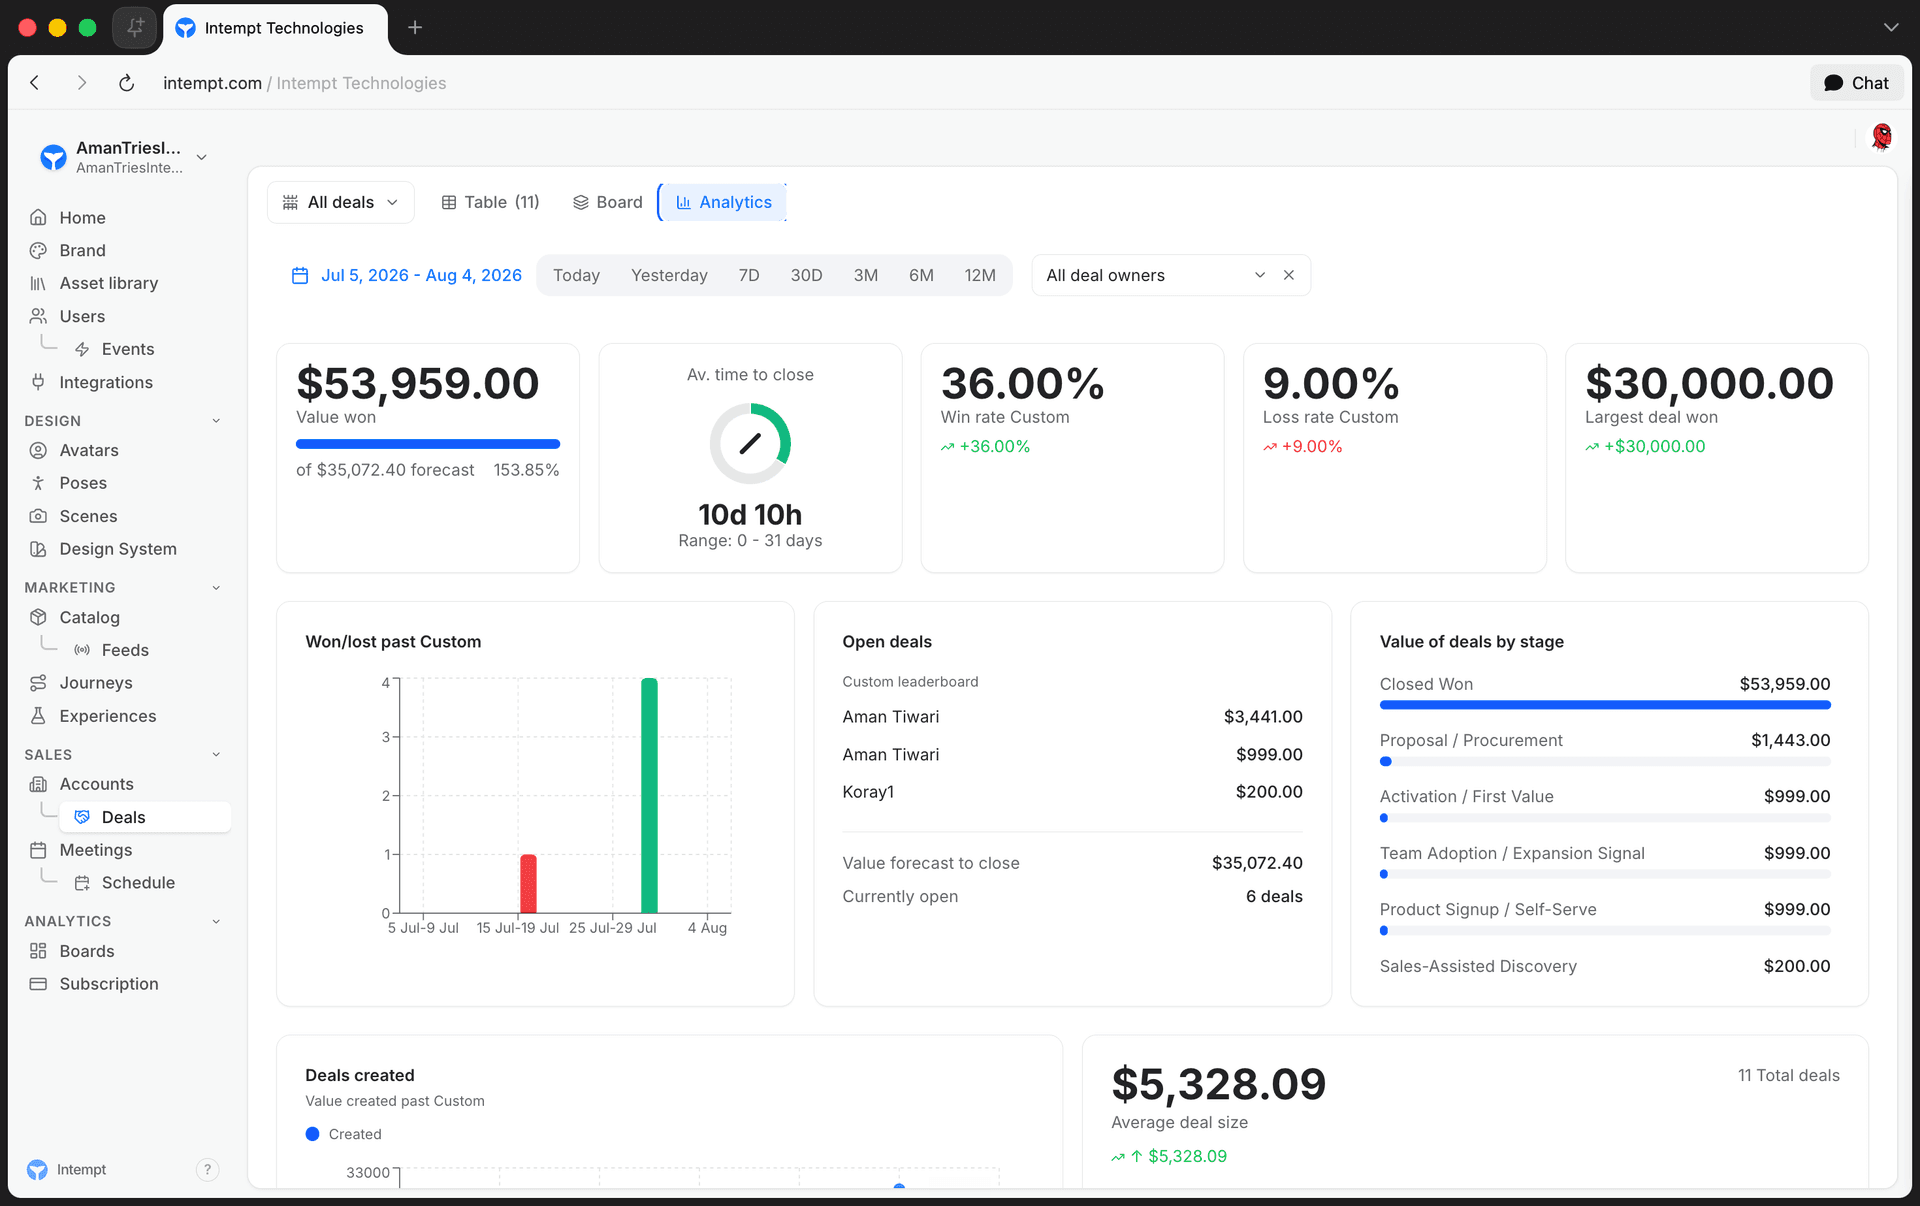
- Value won – total value of won deals in the selected range, with a progress bar showing what percentage of the forecast that represents.
- Av. time to close – the average time between a deal being created and closed, shown as a circular gauge against a range of 0 days to the number of days in the selected date range (90 days by default).
- Win rate – percentage of deals won in the range, with the change versus the prior period.
- Loss rate – percentage of deals lost in the range, with the change versus the prior period.
- Largest deal won – the highest-value deal won in the range, with the change versus the prior period.
Five pipeline charts
- Won/lost past [timeframe] – a bar chart of deals won versus lost, one bar pair per period. The heading names the selected timeframe (for example, "Won/lost past 30D").
- Open deals – a leaderboard of your largest open deals by value, plus the total value forecast to close and the current count of open deals.
- Value of deals by stage – a horizontal bar per stage, showing the total value of deals currently sitting in that stage.
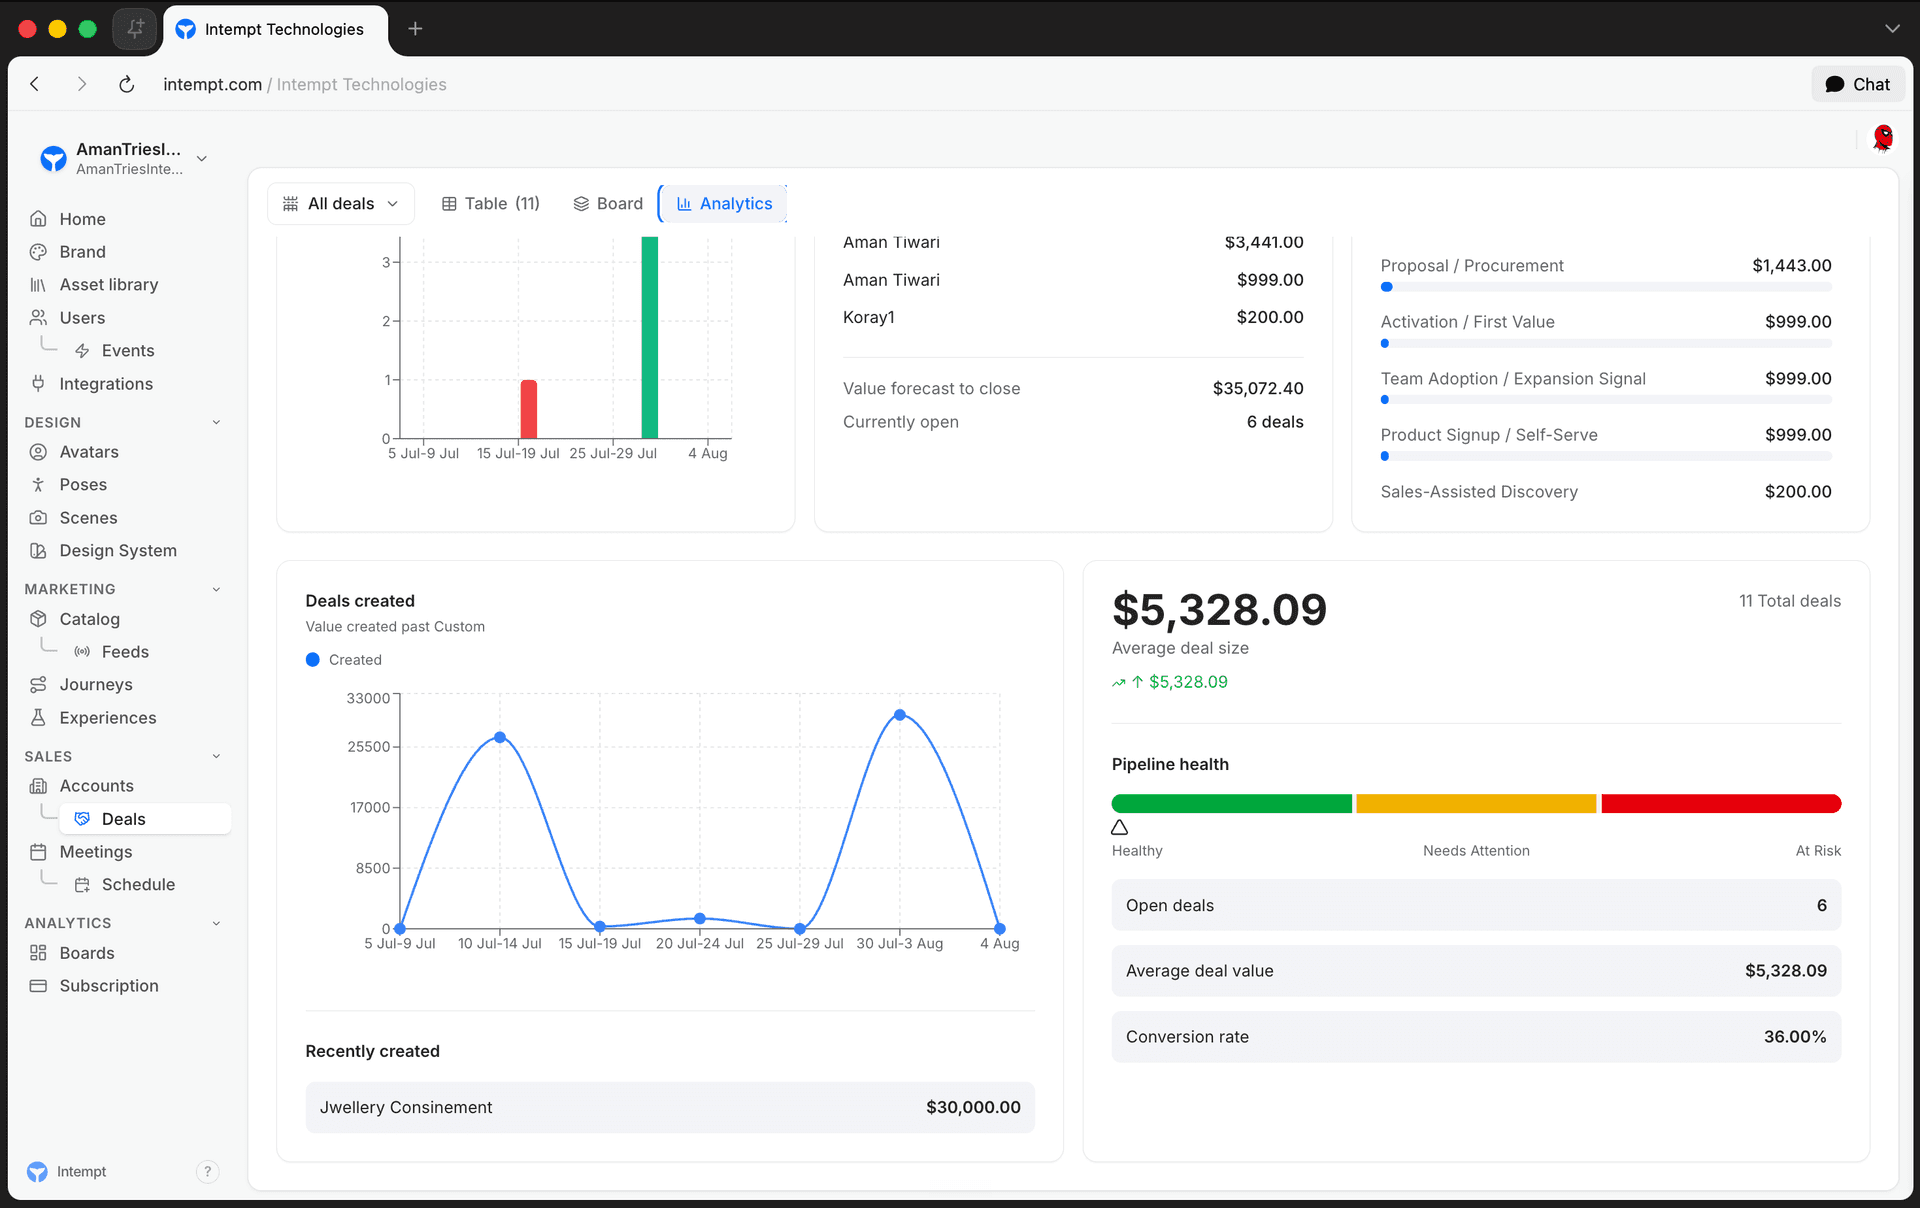
- Deals created – a line chart of value created per period, plus a list of the most recently created deals.
- Average deal size & pipeline health – the average deal size and total deal count, plus a segmented Healthy / Needs Attention / At Risk bar with a marker showing where your pipeline currently sits, and rows for open deal count, average deal value, and conversion rate.
When a date range spans more than 7 days, the Won/lost and Deals created charts bucket the data into 7 periods and sum each bucket, rather than plotting every single day.
Getting started
Open the Analytics tab
- Go to the Deals page.
- Click Analytics in the tab bar next to Table and Board.
Filter by date range and owner
- Click the timeframe switcher and pick Today, Yesterday, 7D, 30D, 3M, 6M, 12M, or Custom for a specific date range.
- Click the deal owner dropdown and select a project member to scope the view to their deals, or leave it on All deal owners.
📘 Good to know
Both filters apply instantly. There's no separate "apply" step.
Read the performance metrics
The five metric cards sit in a row below the filters: Value won, Av. time to close, Win rate, Loss rate, and Largest deal won.
Read the pipeline charts
Below the metrics, five chart cards break the pipeline down further: Won/lost past [timeframe], Open deals (leaderboard, forecast, and open count), Value of deals by stage, Deals created (chart plus a recently-created list), and Average deal size & pipeline health.
Use cases
- Forecasting revenue for a period. Set the date range to the quarter or month you're planning against, then compare Value won to the forecast shown on the Value won card and in the Open deals section.
- Spotting a stalled pipeline. Check Value of deals by stage for a stage holding an unusually large share of pipeline value. That's where deals are piling up instead of progressing.
- Reviewing one rep's pipeline. Filter by deal owner before a 1:1 to see that rep's win rate, loss rate, and average time to close in isolation.
- Tracking a won/loss trend. Use the Won/lost chart to see whether losses are climbing relative to wins over the selected range.
- Watching pipeline health at a glance. Check the Healthy / Needs Attention / At Risk marker on the pipeline health bar before a forecast call.
- Reviewing recent pipeline growth. Use the Deals created chart and recently-created list to see what's entered the pipeline in the current period.
- Comparing reps. Switch the deal owner filter between team members to compare win rate and average deal size side by side.
Where to go next
- Pipeline Overview – how Deals and Accounts work together to track a revenue opportunity from first contact to close.
- Setting Up Your Pipeline – configure deal stages and probabilities before you start reporting on them.
- Deals – full reference for the Deal object, the Kanban board, and deal detail tabs.
Setting Up Your Pipeline
Configure your deal stages and create your first deal so your team can track revenue opportunities from first contact to close.
Task Management (within Accounts/Deals)
How tasks surface and get managed directly inside Account and Deal records, from the AI-assisted Deal Tasks tab to bulk actions on the Account Tasks tab.