
Creating a funnel report
Funnel reports measure how users move from one event to the next across a sequence, and where they drop off.
Overview
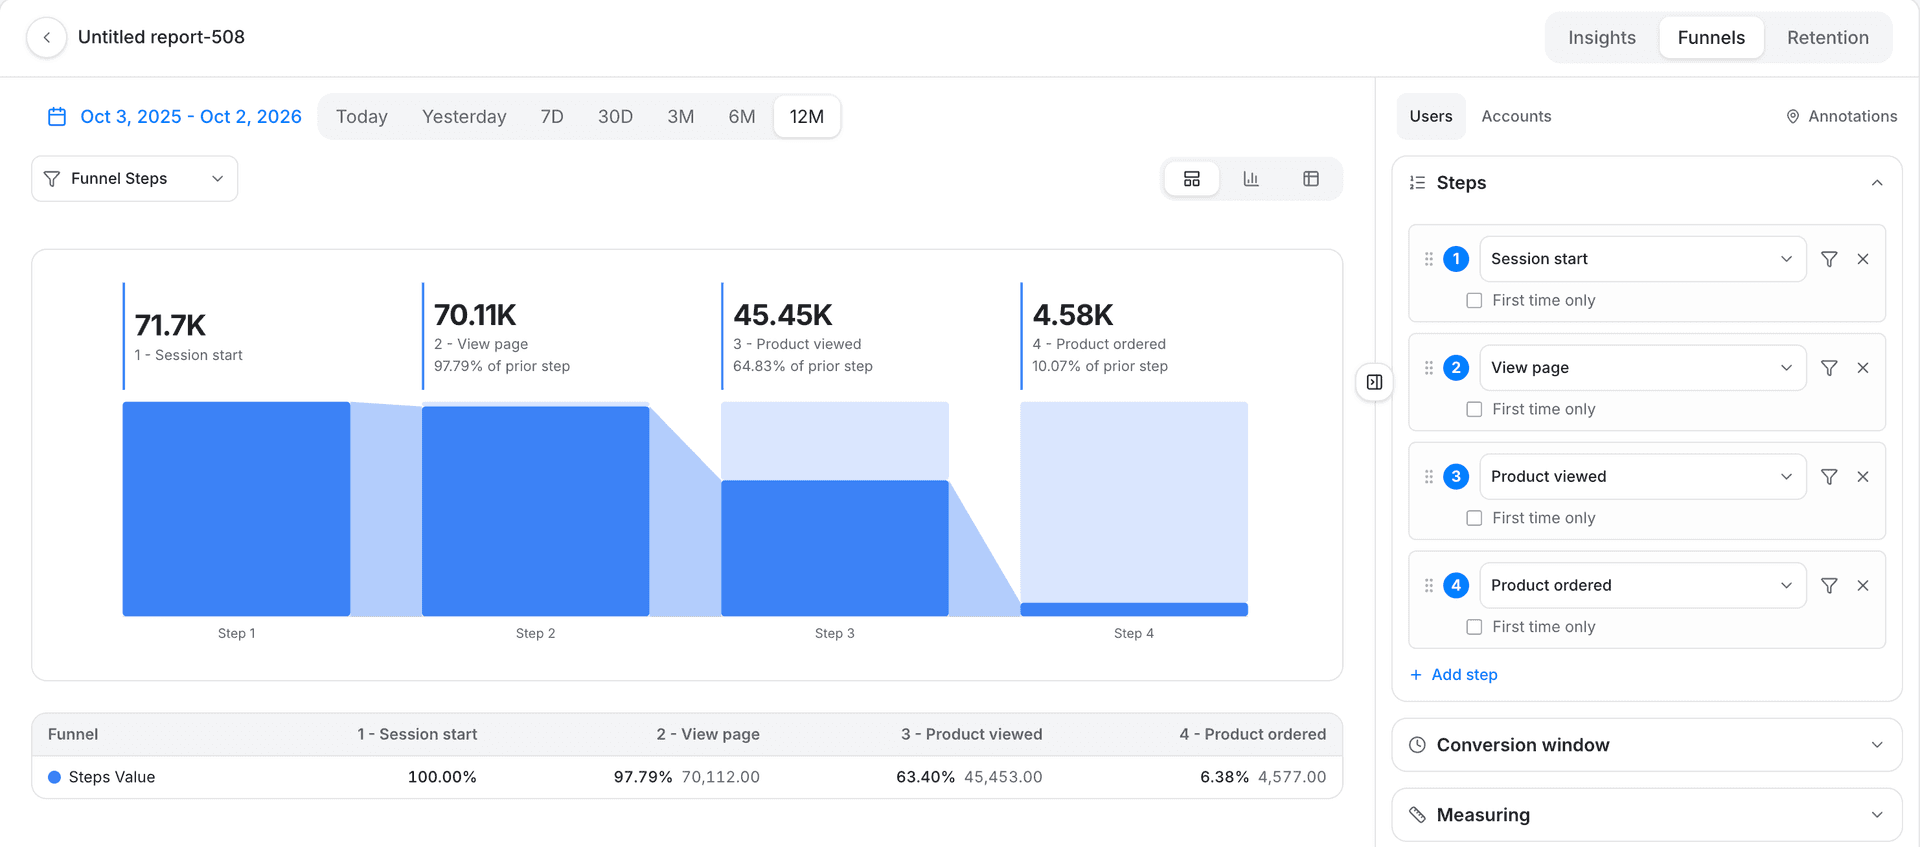
A Funnel report measures how users move through a sequence of events, and where they drop off between steps. Use it to find where a signup or checkout flow loses people, or to compare conversion across segments.
Use cases
- Signup drop-off. Find the step where new users abandon a multi-step signup flow.
- Checkout conversion. Measure how many users who start checkout actually complete a purchase.
- Segment comparison. Add a breakdown to see which channel, plan, or device converts best.
- Re-entries vs. first attempts. Use Total conversions when users can legitimately complete a funnel more than once, and Unique users when you only want each user's first pass counted.
Quick start
- Open the Analytics group in the sidebar and click Boards. Click Create board, pick Funnel, then click Continue.
- Add at least two events, in the order users should complete them.
- Optional: narrow it with a filter, or add a breakdown to compare segments.
- Review the chart: each step's conversion rate and drop-off percentage.
That's a working Funnel report. The sections below cover every option in more depth.
Building it step by step
Selecting funnel steps
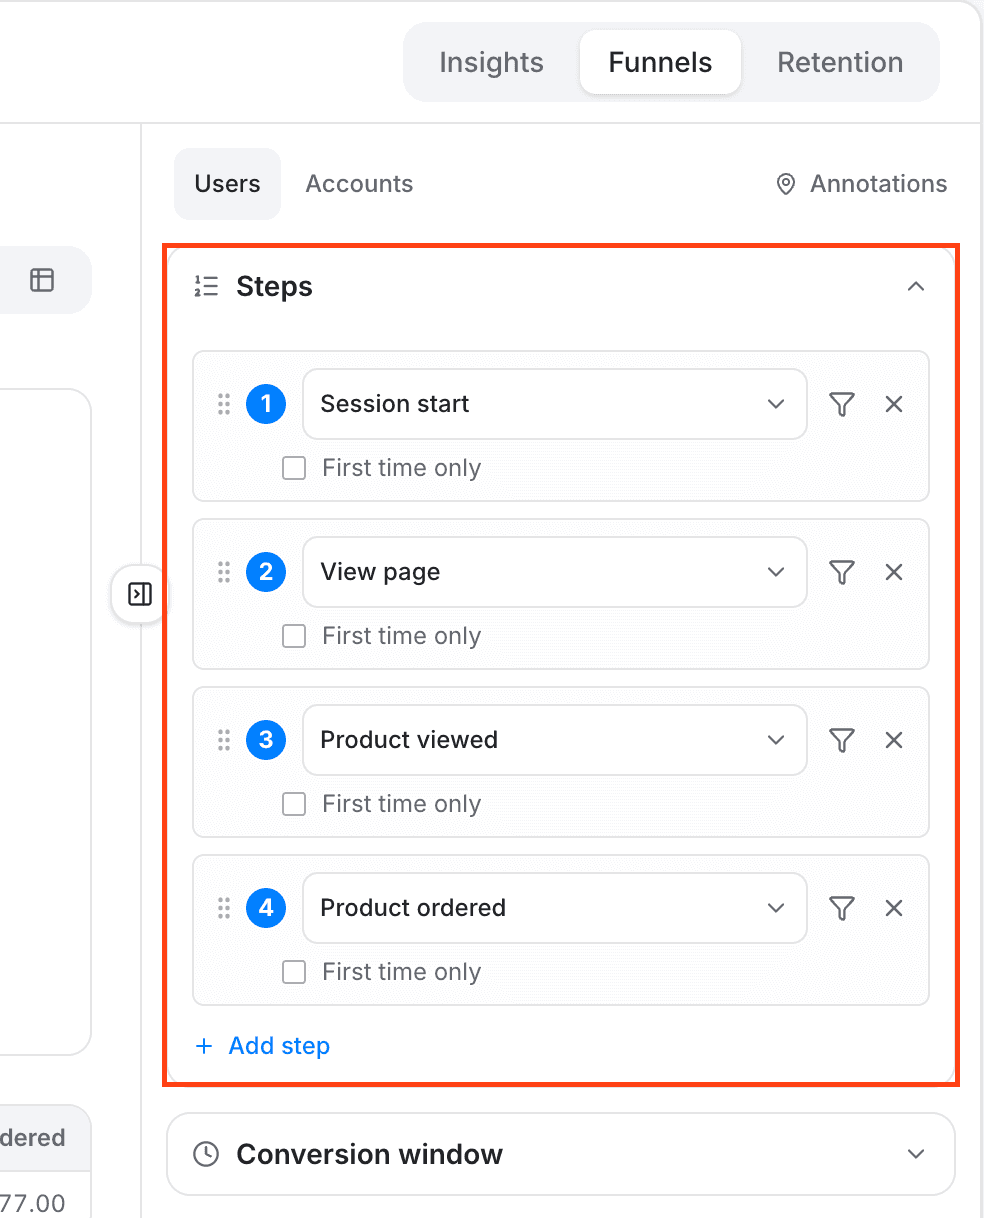
Select at least two events, in the order users should complete them:
- Click Select step under Event in the right-hand panel.
- Choose an event from the dropdown, for example Sign Up, Product Viewed, or Checkout Started.
- Click Add step to add more events. Steps track conversion in the order you add them.
- Check First time only on a step to count just a user's first occurrence of that event, instead of any occurrence.
Setting the conversion window
The conversion window is how much time a user has to complete every step after entering the funnel, from 1 minute up to 366 days (or the equivalent in months or weeks).
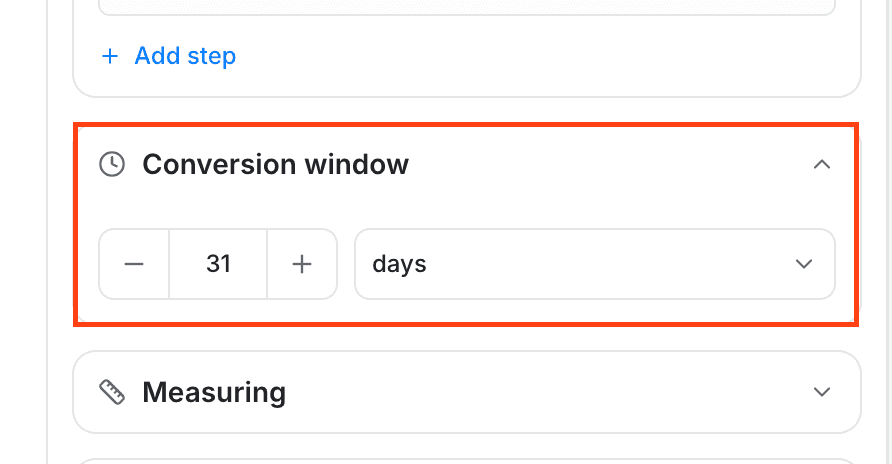
Example: with steps A → B → C and a one-hour conversion window, a user who does A at 10:00 PM, repeats A at 10:30 PM, then B at 10:45 PM and C at 11:15 PM is counted as reaching B but not completing the funnel to C, because 11:15 PM is more than an hour after the first A. The window starts from the first occurrence of A and doesn't restart when A happens again within the same attempt.
Choosing a measurement
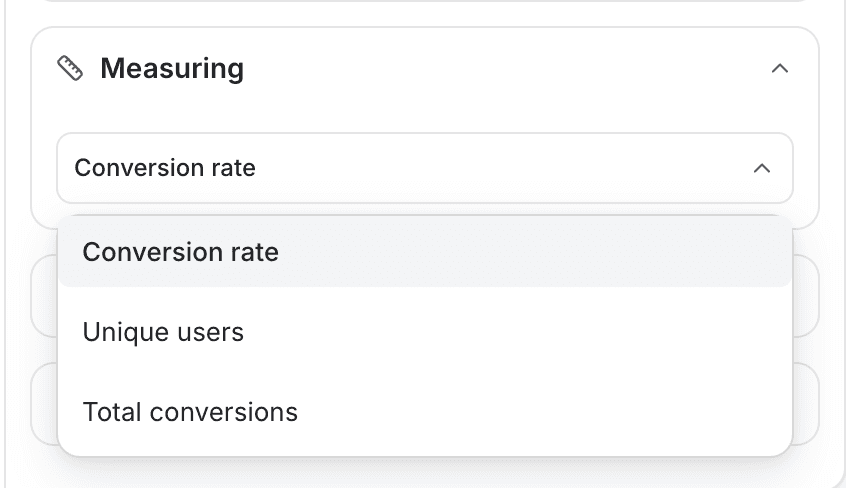
| Measurement | What it measures |
|---|---|
| Conversion rate | The rate at which users complete the selected steps. |
| Total conversions | The total number of times users reached the selected step. A user can re-enter and convert more than once. |
| Unique users | Distinct users who completed the steps, based on their first attempt within the report's timeframe. |
A funnel always measures conversion across every step you've defined, start to finish, there's no way to narrow it to a sub-range of steps.
Filters and breakdowns
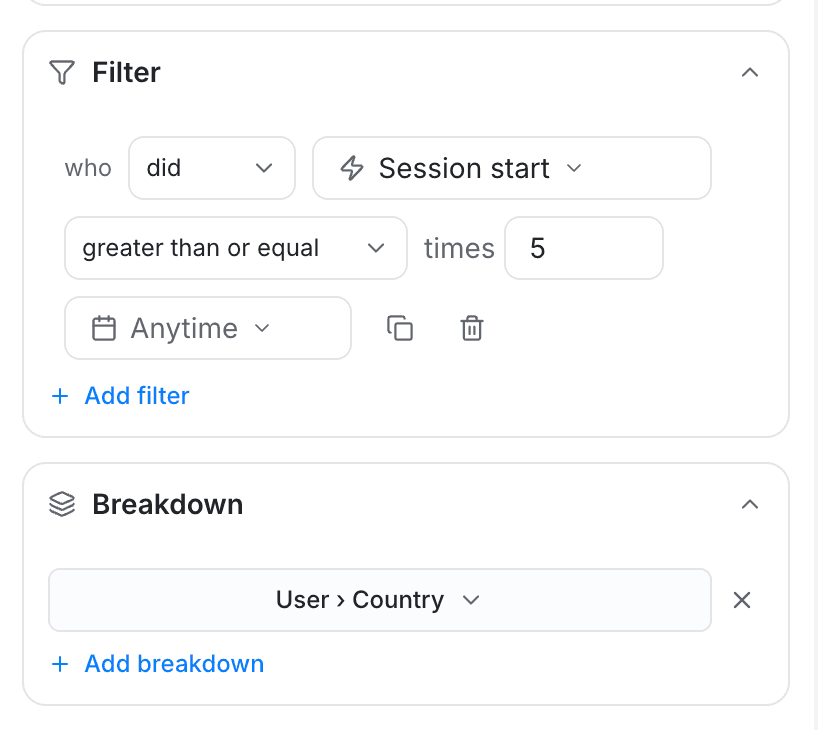
- Filters. Click Add Filter to narrow the report to a subset of users, for example by cart activity, price range, device, location, or a custom property. Filters apply globally across every step.
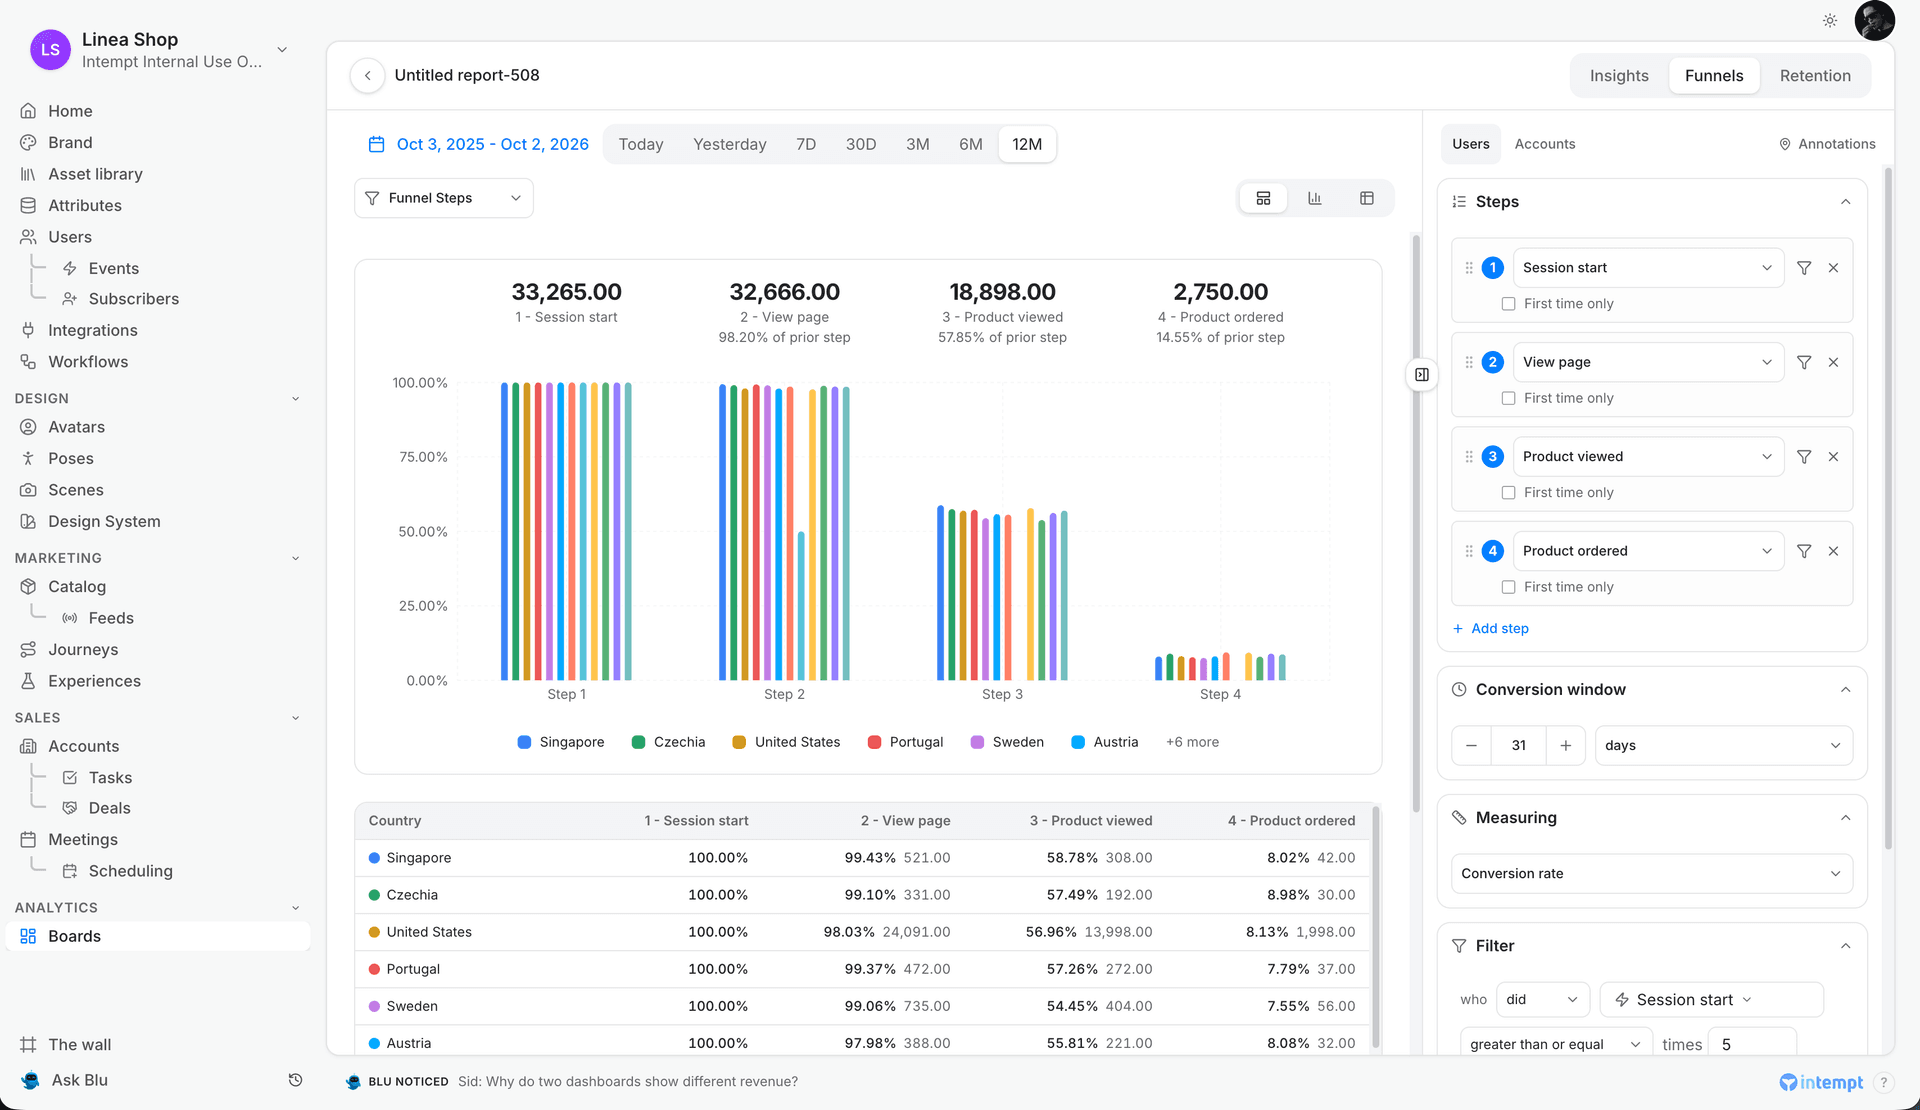
- Breakdowns. Click Add Breakdown to segment by an attribute like city, country, plan, browser, or device. Each group gets its own colored path in the chart and its own row in the table, up to two breakdowns at a time.
Reading the results
Once at least two steps are selected, the funnel visualization renders, showing each step's conversion rate (or the measurement you chose) and its drop-off percentage. If breakdowns are applied, each group is color-coded so you can compare them directly.
Where to go next
- Analytics for what reports and dashboards do and which report type to reach for.
- Creating an insights report to analyze trends and event volume instead.
- Creating a retention report to measure return behavior instead of a sequence.
- Dashboards to add this report to a shared board.
Using attribution models
Which touch gets the credit when a deal closes, and why the answer changes the number. Set the attribution model on an Insights report and compare two.
Creating a retention report
Retention reports show how many users return and repeat an event after their first interaction, grouped by day, week, or month.