
Subscription analytics
The Subscription board tracks your organization's own subscription revenue: MRR, subscriber counts, churn, plan mix, and trial conversion, synced from Stripe.
Overview
The Subscription board is a dedicated analytics view of your organization's subscription revenue, separate from the general-purpose Boards you build yourself. It's built for tracking a subscription business: monthly recurring revenue (MRR), subscriber counts, churn, plan-level breakdowns, net revenue retention, and trial-to-paid conversion, all sourced from the Stripe source you connect to Intempt.
Find it under Analytics in the sidebar, inside Boards. It is no longer a separate sidebar entry of its own, it moved into Boards as two tabs, MRR and Subscribers, and the old /subscription route now redirects there.
💡 Good to know
Unlike Insights, Funnel, or Retention reports, there's nothing to build here. Connect your Stripe source and the board populates itself, no report to configure, no events to pick.
💡 Good to know
This is different from your organization's own billing plan with Intempt (your seats, base fee, and usage charges). For that, see Usage & billing. The Subscription board reports on the subscriptions your organization sells to its own customers through Stripe.
Understanding MRR
Monthly Recurring Revenue (MRR) is the predictable revenue your business expects to collect every month from active subscribers. If 10 customers each pay $100/month, your MRR is $1,000, a baseline for what next month looks like if nothing changes. A customer cancelling lowers it; a customer upgrading raises it.
MRR isn't the same as cash actually collected this month, it's a normalized run rate, not a forecast or a bank balance. Annual plans are normalized to a monthly figure: a customer paying $1,200 a year contributes $100 a month to MRR.
Understanding Subscribers
Subscribers counts how many distinct customers currently have an active subscription, independent of what they're paying. A customer who upgrades or downgrades doesn't change this number at all, they're still one subscriber either way; only someone joining, cancelling, or coming back moves it.
That's also why Expansion and Contraction only show up in the MRR view: an existing subscriber paying more or less is still the same subscriber, so there's nothing for a headcount to register beyond them continuing to be counted.
Use cases
- Catch revenue risk before the month closes. Watch Net MRR Movement and Churn MRR mid-month instead of waiting for a finance close.
- Track progress toward a revenue target. Set an MRR goal and watch the progress bar move as the month plays out.
- Spot duplicate Stripe products. The warning icon on the plans table flags when two plans share a name, so you can clean up your Stripe catalog.
- Judge whether growth is healthy or just wide. Toggle between MRR and Subscribers to see whether revenue growth is coming from more subscribers or from existing subscribers paying more.
- Catching logo churn hidden by revenue growth. A few expanding accounts can offset lost MRR on the trend line while your subscriber count quietly shrinks, watch Subscribers for the customer-count story MRR alone won't tell you.
- Evaluate your trial funnel. Use the Trial-to-Paid conversion rate to decide whether a pricing or onboarding change actually moved the needle.
- Check whether expansion is offsetting churn. Read the NRR trend alongside Expansion Revenue to see if upsells are covering what churn is costing you.
- Pull numbers for a board update. The movements table gives a ready month-by-month breakdown of new business, expansion, contraction, churn, and reactivation.
How it works
Switching between MRR and Subscribers
A toggle at the top of the board switches every chart and table between two views:
- MRR: dollar values, current MRR, MRR movements, MRR by plan.
- Subscribers: headcount values, total subscriber count, subscriber movements, subscribers by plan.
The KPI cards, trend chart, movements table, and plan breakdown chart all follow this toggle.
KPI cards and goals
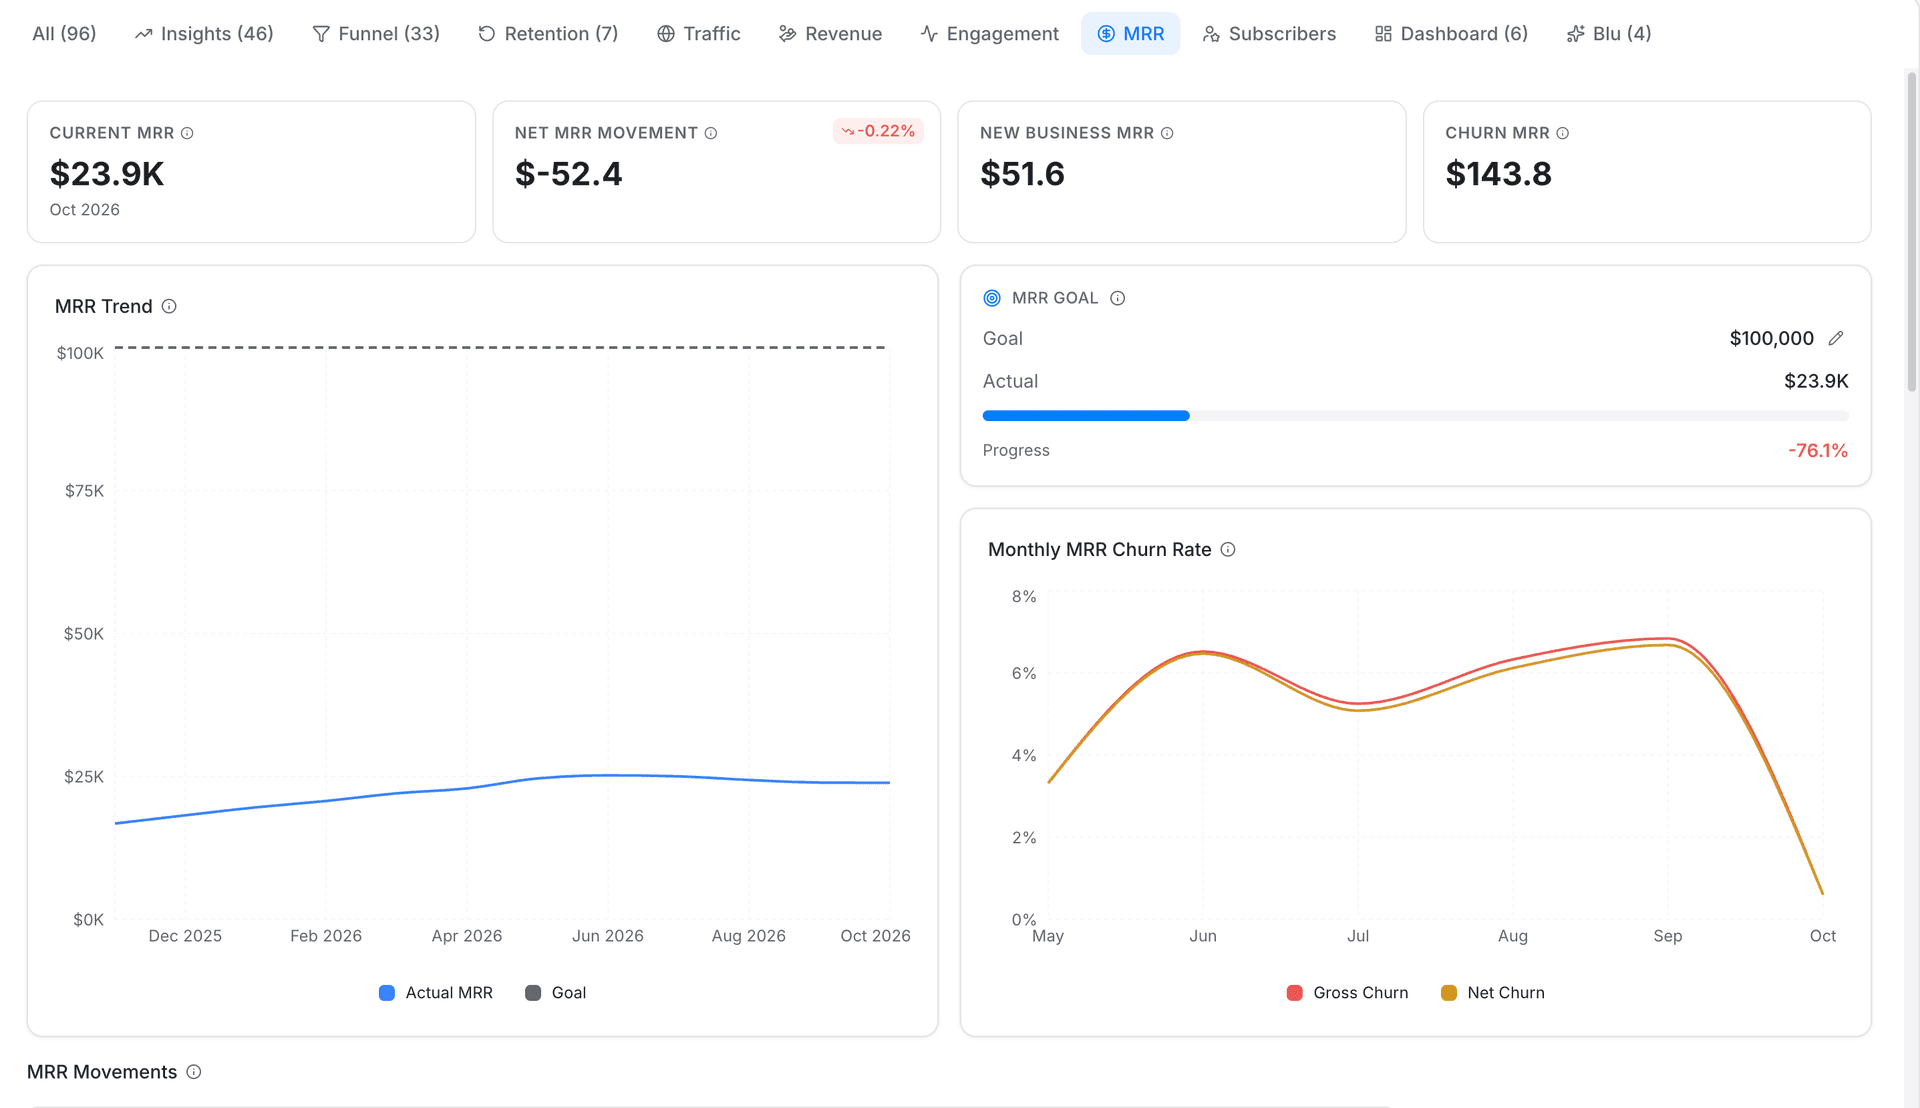
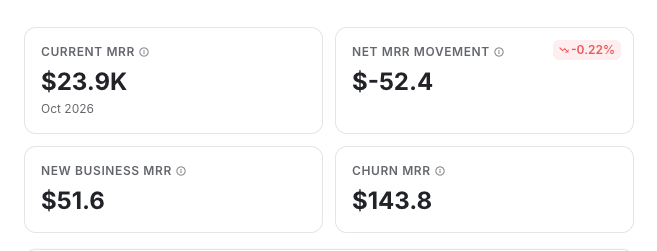
Four KPI cards sit at the top of the board. Which four you see depends on the MRR/Subscribers toggle:
| MRR view | Subscribers view |
|---|---|
| Current MRR | Total Subscribers |
| Net MRR Movement | Net Change |
| New Business MRR | New Subscribers |
| Churn MRR | Churned |
Below the KPI cards is a goal card. It compares your actual MRR (or subscriber count) against a target you set, with a progress bar and a percentage that turns green once you're at or above goal. Select the pencil icon next to the goal value to edit it.
Trend and churn charts
The MRR/Subscriber Trend chart plots your actual value against your goal over time, month by month.
The Churn Rate chart below it shows gross churn against net churn for the last six months.
Gross churn is what you lost to cancellations, as a percentage of the MRR (or subscriber count) you started the month with. Net churn subtracts expansion revenue from that loss first, so it can go negative when expansion outpaces churn, a sign your existing customers are growing faster than you're losing them.
For example, losing $3,570 out of $113,740 starting MRR is 3.1% gross churn. If you also gained $1,700 in expansion that same month, net churn drops to 1.6%.
Movements table
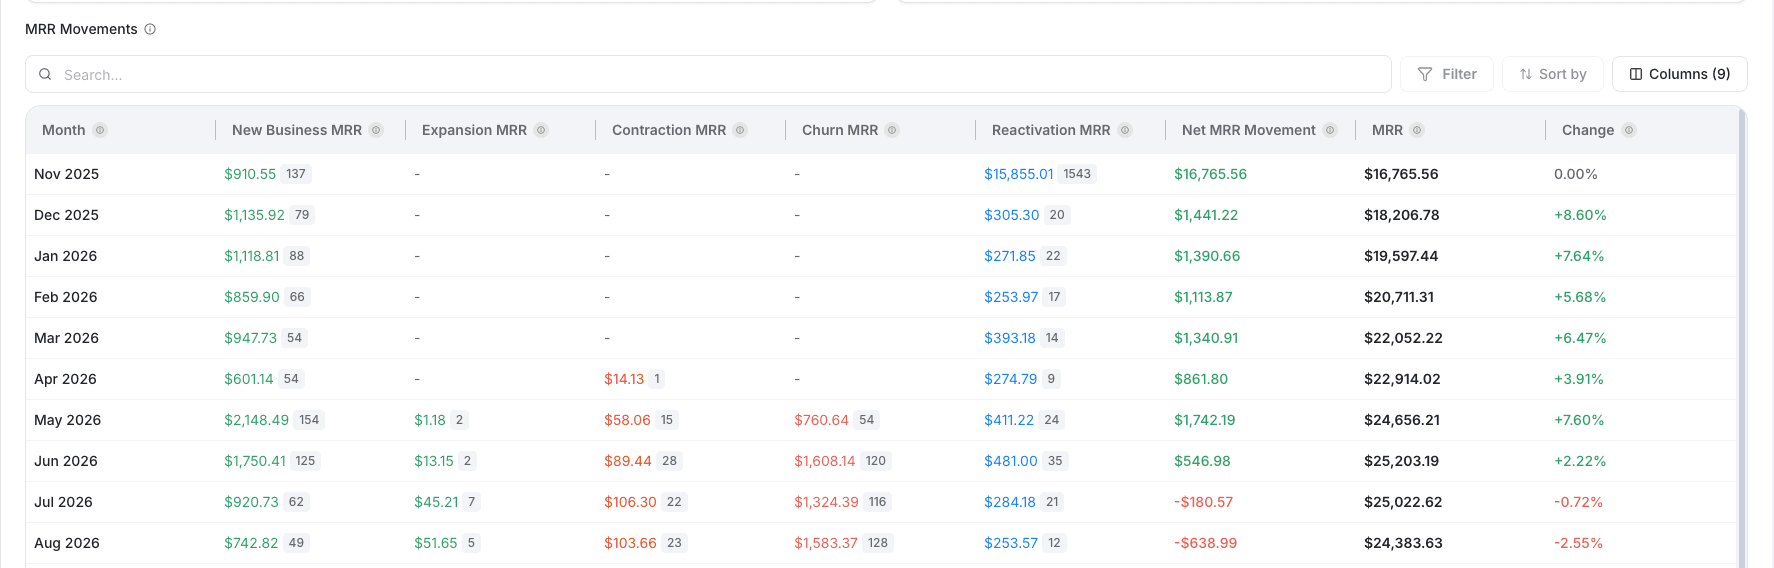
The movements table breaks down what changed each month, in MRR or in headcount, depending on the toggle:
- New Business. Revenue or customers from brand new subscribers this month.
- Expansion. Extra revenue from existing customers who upgraded or added seats. There's no subscriber-count equivalent, expansion is an MRR-only concept.
- Contraction. Revenue lost from existing customers who downgraded, shown as a positive number, the column name carries the sign.
- Churn. Revenue or customers lost to cancellations this month.
- Reactivation. Revenue or customers from someone who'd previously cancelled and came back.
Each cell shows the affected subscriber count right next to the dollar amount. Net MRR Movement (or Net Change, for subscribers) is New Business + Expansion + Reactivation, minus Contraction and Churn, followed by the running MRR total and the month-over-month percentage change. The table also has its own search, filter, sort, and column picker, independent of the board's shared date range and filters.
Plans breakdown
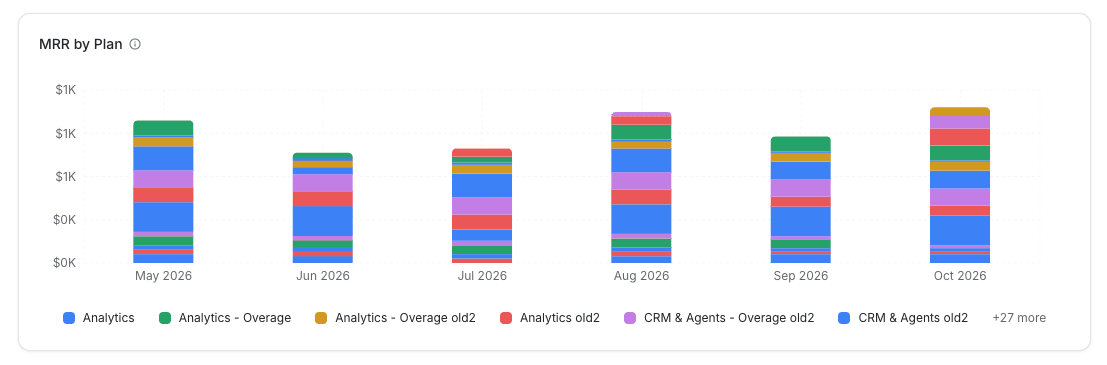
A stacked bar chart shows MRR (or subscribers) split by plan, month by month. Below the chart, a table lists each plan with its price, billing interval (Monthly or Annually), active customer count with percentage share, and (in MRR view) MRR contribution with percentage share.
If two plans share the same name, a warning icon appears next to them, pointing you to check your Stripe dashboard to tell them apart.
Retention and trial conversion
Three more panels round out the board:
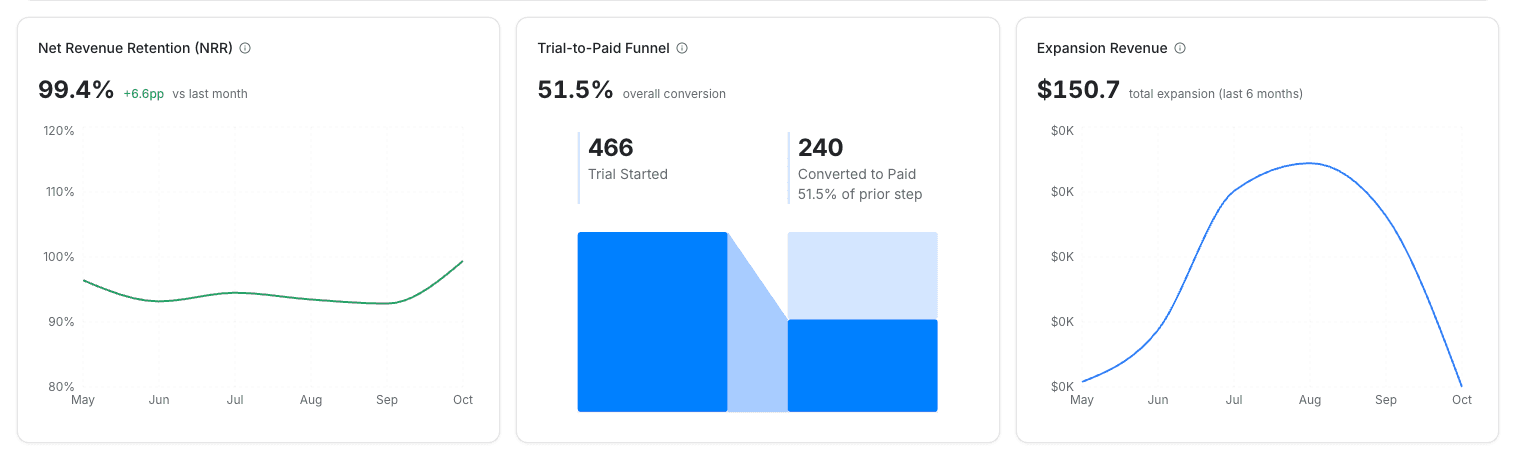
- Net Revenue Retention (NRR). The single most telling subscription health number: your starting MRR, plus expansion, minus contraction and churn, as a percentage of where you started. New business isn't part of the calculation. NRR above 100% means your existing customers' revenue is growing even before counting a single new sale.
- Trial-to-Paid Funnel. Overall conversion rate from trial sign-up to paid subscription, shown as a two-step funnel: Trial Started and Converted to Paid.
- Expansion Revenue. Cumulative revenue growth from existing customers upgrading or expanding, over the last six months.
Where to go next
- Analytics for what reports and dashboards do and which report type to reach for.
- Stripe for connecting the source this board reads from.
- Usage & billing for how Intempt itself bills your organization.
- Dashboards for building your own custom analytics boards.
Building a dashboard
A dashboard brings together reports, journey results, experience results, and text notes on one board, all filterable by a shared date range.
Traffic, Revenue, and Engagement boards
Three built-in boards that come pre-populated from data you already track, no connection to set up, no report to build.