
Introduction to Analytics
Analytics turns the events you track into reports and dashboards: build Insights, Funnel, and Retention reports on user or account behavior, then combine them onto a dashboard to monitor your KPIs.
Covered in the Academy. Intempt Academy covers analytics part 1: insights, funnels and retention step by step.
Overview
Analytics is where tracked events become reports and dashboards. A report answers one question about behavior, an Insights trend, a Funnel conversion, or a Retention curve, and a dashboard brings several reports (plus journey results, experience results, and notes) together on one board so you can monitor them at a glance. A separate Subscription board covers your organization's own Stripe-based revenue: MRR, churn, and plan mix. Three more boards, Traffic, Revenue, and Engagement, come built in and need no setup at all.
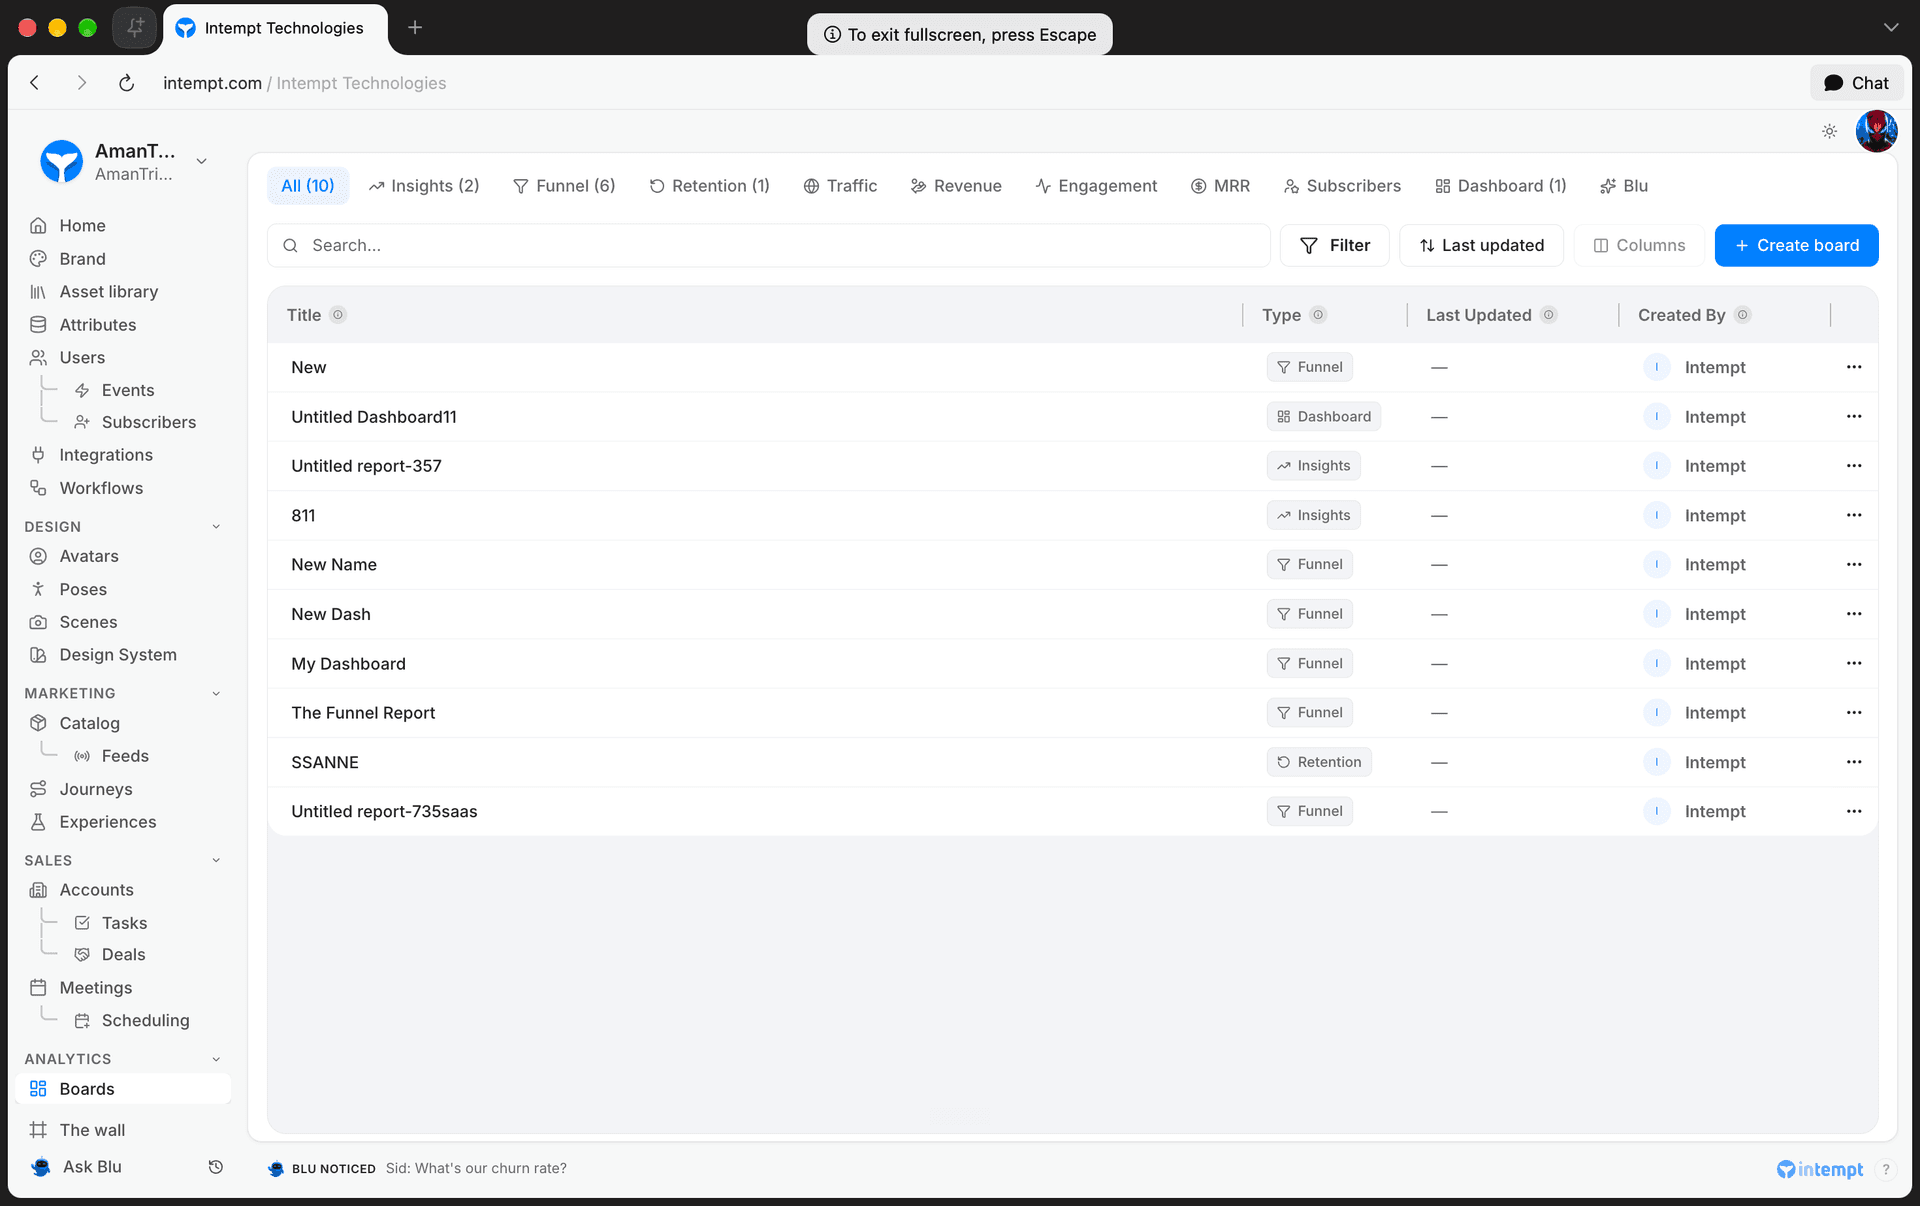
Open the Analytics group in the sidebar and click Boards. Reports and dashboards live in the same list: click Create board, pick Insights, Funnel, Retention or Dashboard, then click Continue. A tab bar across the top lets you filter that list down to just one kind, including Traffic, Revenue, Engagement, MRR, Subscribers, and Blu, the reports Blu has saved for you.
Which report do you need?
-
Is a number going up or down, or how does it break down by segment? Build an Insights report. It's the one you'll reach for most, trends, distributions, breakdowns by device or plan, whatever the question is about a metric over time.
-
Where are people dropping off in a sequence? Build a Funnel. Give it a signup flow or a checkout, and it shows you exactly which step is losing people.
-
Do users actually come back? Build a Retention report. It tracks how many users repeat an action after their first visit, and how that fades over time.
-
Which touchpoint deserves the credit for a conversion? That's Attribution, not a report type of its own, it's a setting you turn on inside an Insights report.
-
Want a few of these on one screen? Put them on a Dashboard instead of flipping between reports one at a time.
-
Curious how your subscription revenue is doing? Subscription analytics tracks MRR, churn, and plan mix straight from Stripe.
-
Want traffic, revenue, or engagement numbers without building anything? Traffic, Revenue, and Engagement boards come pre-built from data you're already tracking.
-
None of the above quite fit? Just ask Blu. See Building a Custom Report with Blu.
📘 Good to know
Events from an Events only source count in event analytics, such as an event's total count over time. They have no user or account behind them, so they add nothing to user analytics: unique users, per-user funnels, retention and user or account breakdowns. See What a source collects.
Use cases
-
Activation tracking. Build a WAU or frequency Insights report to see how often users get value after signing up.
-
Drop-off analysis. Build a Funnel report across your signup or checkout steps to find where users abandon before converting.
-
Engagement measurement. Build a Retention report to see how many users come back and repeat a key action after their first interaction.
-
Account-level trends (B2B). Switch an Insights report's profile to Accounts to see how companies, not just individuals, interact with your product.
-
Cross-device behavior. Use Insights breakdowns to see how the same customer's actions differ across devices.
-
Crediting the right channel. Apply an attribution model to an Insights breakdown to see what actually drove a conversion, not just what happened last.
-
KPI monitoring. Add your key reports to a dashboard, set a shared date range, and check it regularly instead of rebuilding the same charts.
-
Experiment results monitoring. Add an experience's results to a dashboard to track its performance alongside the rest of your metrics.
-
Tracking subscription revenue. Use the Subscription board to watch MRR, churn, and plan mix synced from Stripe.
-
Checking traffic sources or engagement without setup. Open the Traffic, Revenue, or Engagement board, built in, no report to configure.
Dashboards
A dashboard is a customizable board where you place reports, journey results, experience results, and text notes so you can track what matters at a glance. Every widget shares the same date range, and you can arrange, resize, and edit each one independently. See Dashboards for the full walkthrough.
Subscription analytics
If you've connected Stripe, a separate Subscription board reports on your own organization's recurring revenue: MRR, subscriber counts, churn, plan mix, and trial conversion. It's a distinct surface from the Boards you build yourself. See Subscription analytics for the full walkthrough.
Traffic, Revenue, and Engagement boards
Three more fixed boards come built in, pulling from data you're already tracking: Traffic (where visitors come from), Revenue (purchases and retention), and Engagement (sessions and active users). No connection to set up and nothing to build, they're read-only, same as Subscription analytics but without a connection gate. See Traffic, Revenue, and Engagement boards for the full walkthrough.
Where to go next
Exposure and denominators
An exposure is one person seeing one answer, even when the rollout counts accounts. Read every rate on this page before you compare a rollout's numbers to an experiment's.
Creating an insights report
Insights reports plot trends and distributions for events or segments, at the user or account level, with breakdowns, filters, formulas, and attribution.