
Traffic, Revenue, and Engagement boards
Three built-in boards that come pre-populated from data you already track, no connection to set up, no report to build.
Overview
Traffic, Revenue, and Engagement are three fixed boards that come built in, out of the box. Unlike Insights, Funnel, or Retention reports, there's nothing to build, and unlike the Subscription board, there's no third-party connection to set up. They read from data you're already tracking, page views, sessions, purchases, UTM parameters, device and location, the moment the Intempt SDK is installed.
Find them under Analytics, inside Boards: they're tabs on the same list as your own reports, not a separate page. The same tab bar also has MRR, Subscribers, and Blu (reports Blu has saved for you), alongside your own Insights, Funnel, Retention, and Dashboard items.
Use cases
- Where visitors come from. Check the Traffic board's Channel or Campaign breakdown without building a report.
- Which pages pull their weight. Use Traffic's Page breakdown to see top entry pages and overall page performance.
- Revenue at a glance. Open the Revenue board for purchase trends and retention without configuring an Insights report first.
- Spotting who's active. Check Engagement for sessions, active users, and retention in one place.
- Comparing Revenue by OS or segment. See whether a particular device or RFM segment is driving purchases.
How it works
Shared controls
All three boards share the same chrome: a timeframe switcher, a group-by selector, and a manual refresh button. Above the board itself sits one shared performance summary strip common to all three: RFM scoring-segment tiles, Users metrics (Total, Active, New, Returning), and Revenue tiles (Yesterday, Total period, Intempt-attributed purchases and revenue).
💡 Good to know
These boards are read-only. There's no Add content, no Card Settings, no drag-and-resize, you read them, you don't build them. For a board you configure yourself, see Building a dashboard.
Traffic
Four tabbed, ranked breakdown widgets. Each one has a Users/Revenue sort toggle (rank by how many people, or by how much revenue that group brought in) and a Top-N limit (show the top 10, 25, 50, or 100 entries).
- UTM. Breaks traffic down by Channel, Referrer, or Campaign, the three sub-tabs. This is where you'd check which marketing source is actually sending people in, not just which one you spent budget on.
- Page. Breaks traffic down by Page or, on its Entry page sub-tab, specifically the page someone landed on first. Useful for telling apart your highest-traffic pages from your actual front door.
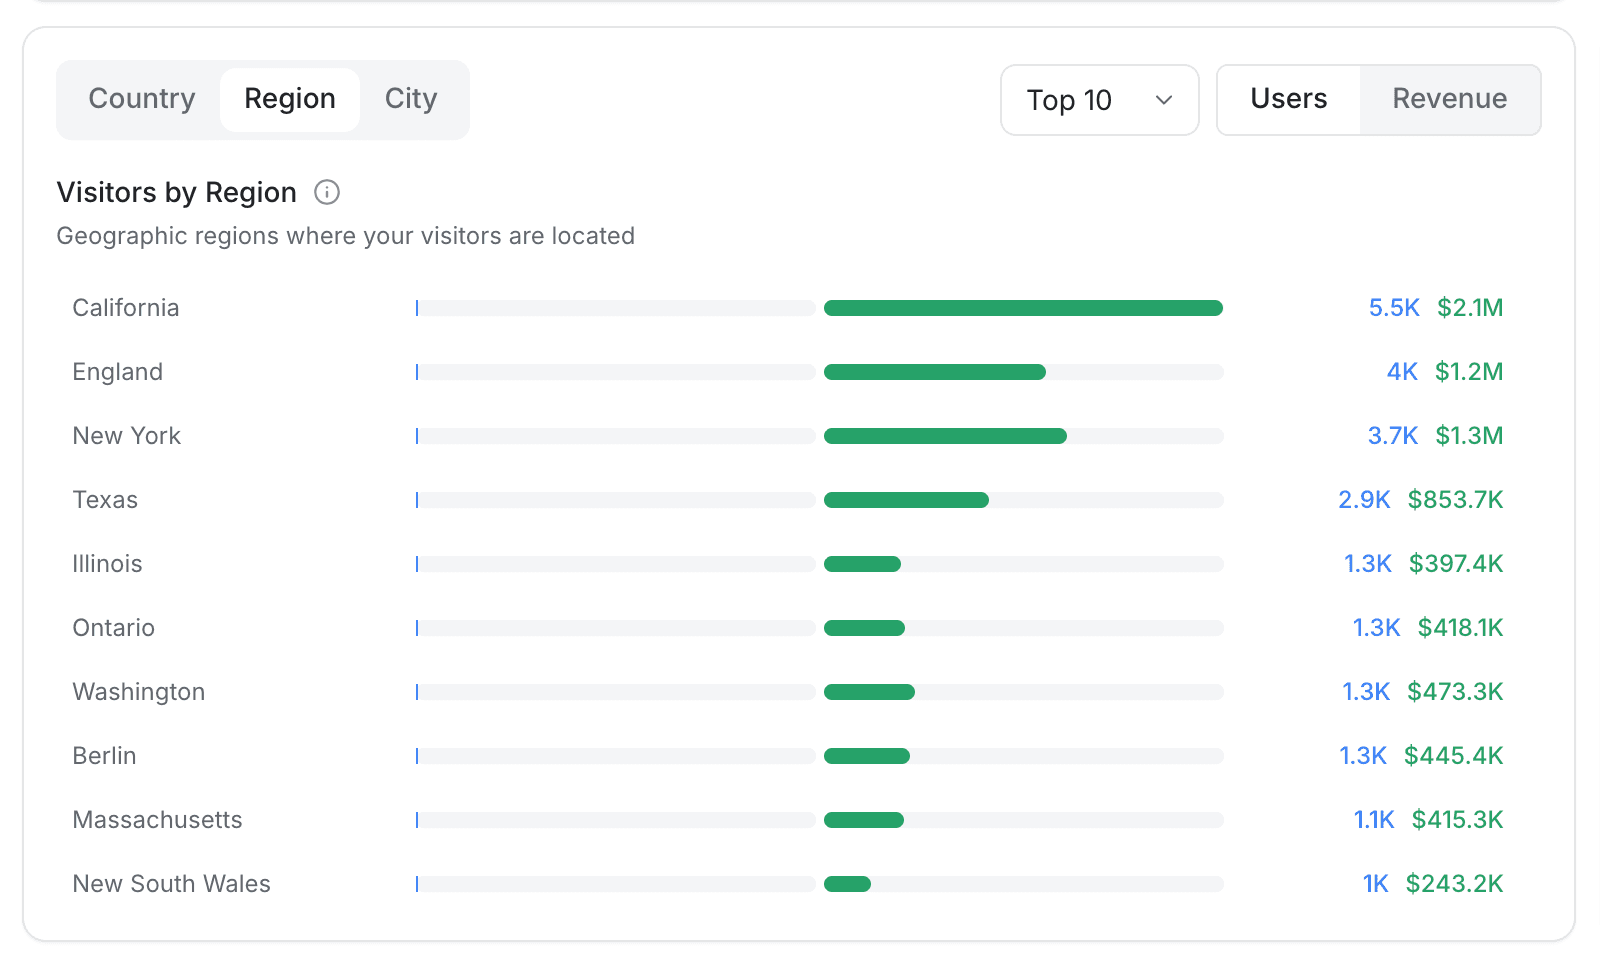
- Location. Breaks traffic down by Country, Region, or City, a straightforward geographic read on where your visitors are.
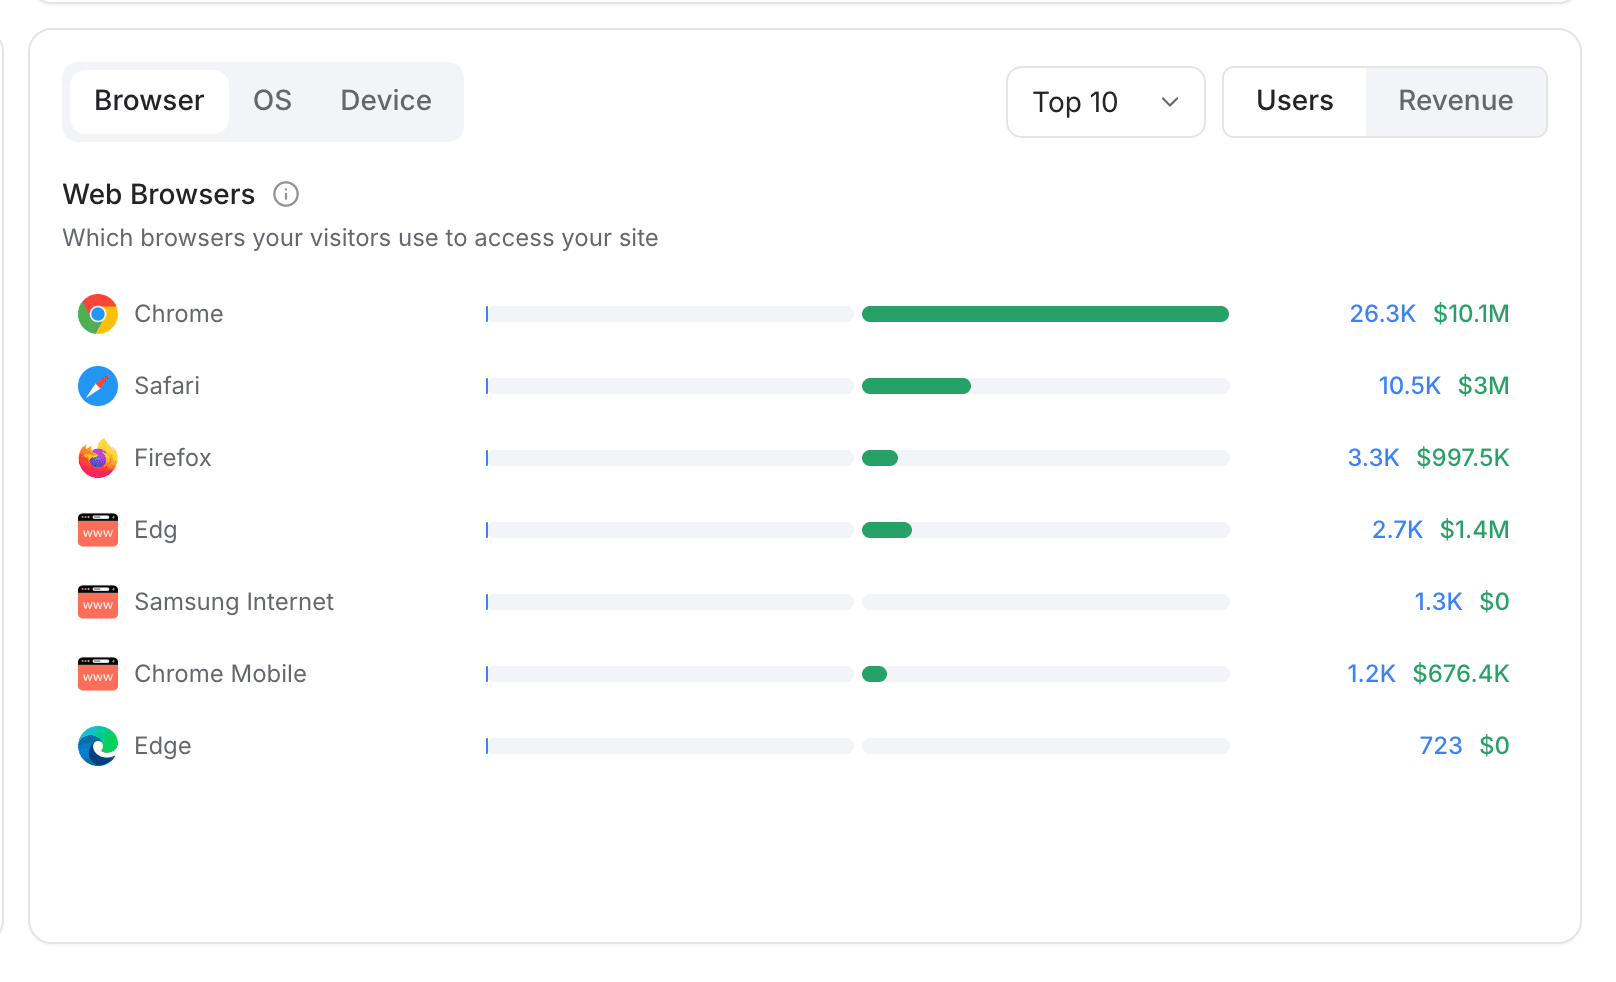
- Device. Breaks traffic down by Browser, OS, or Device type. Good for catching a bug affecting one browser specifically, or just confirming how much of your traffic is mobile versus desktop.
Revenue
- Traffic & Revenue Overview. A combined chart plotting visitors against revenue over the same period, so you can see at a glance whether more traffic is actually converting into more revenue, or whether the two have started to diverge.
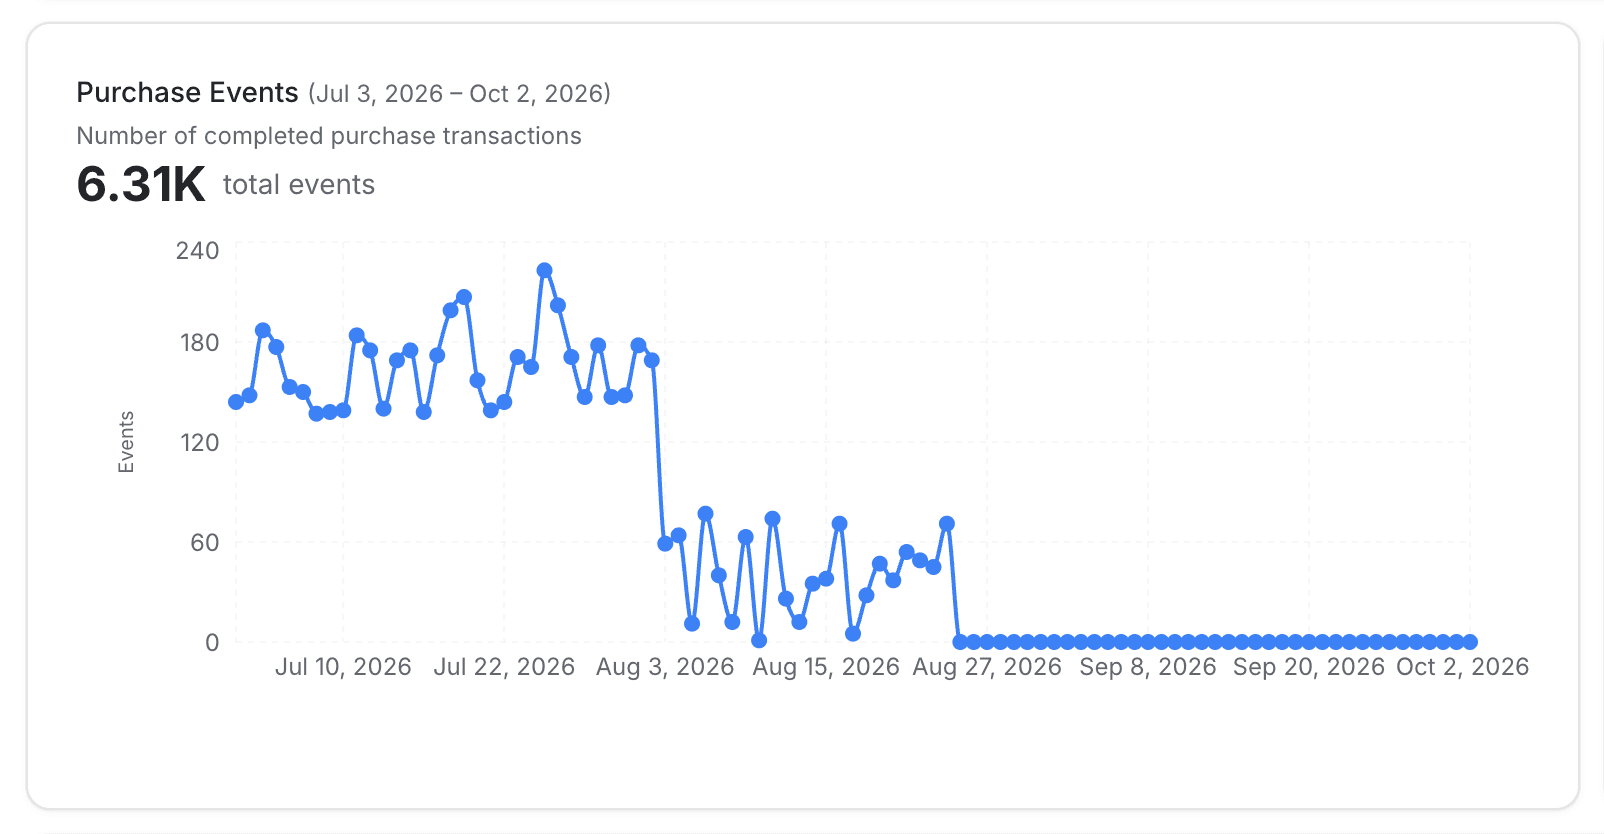
- Purchase Events. The number of completed purchase transactions, plotted day by day.
- Total Purchase Revenue. The headline number, total revenue collected, plotted over time.
- Weekly Retention. How many of a given week's customers come back and purchase again in a later week, revenue's own version of a retention curve.
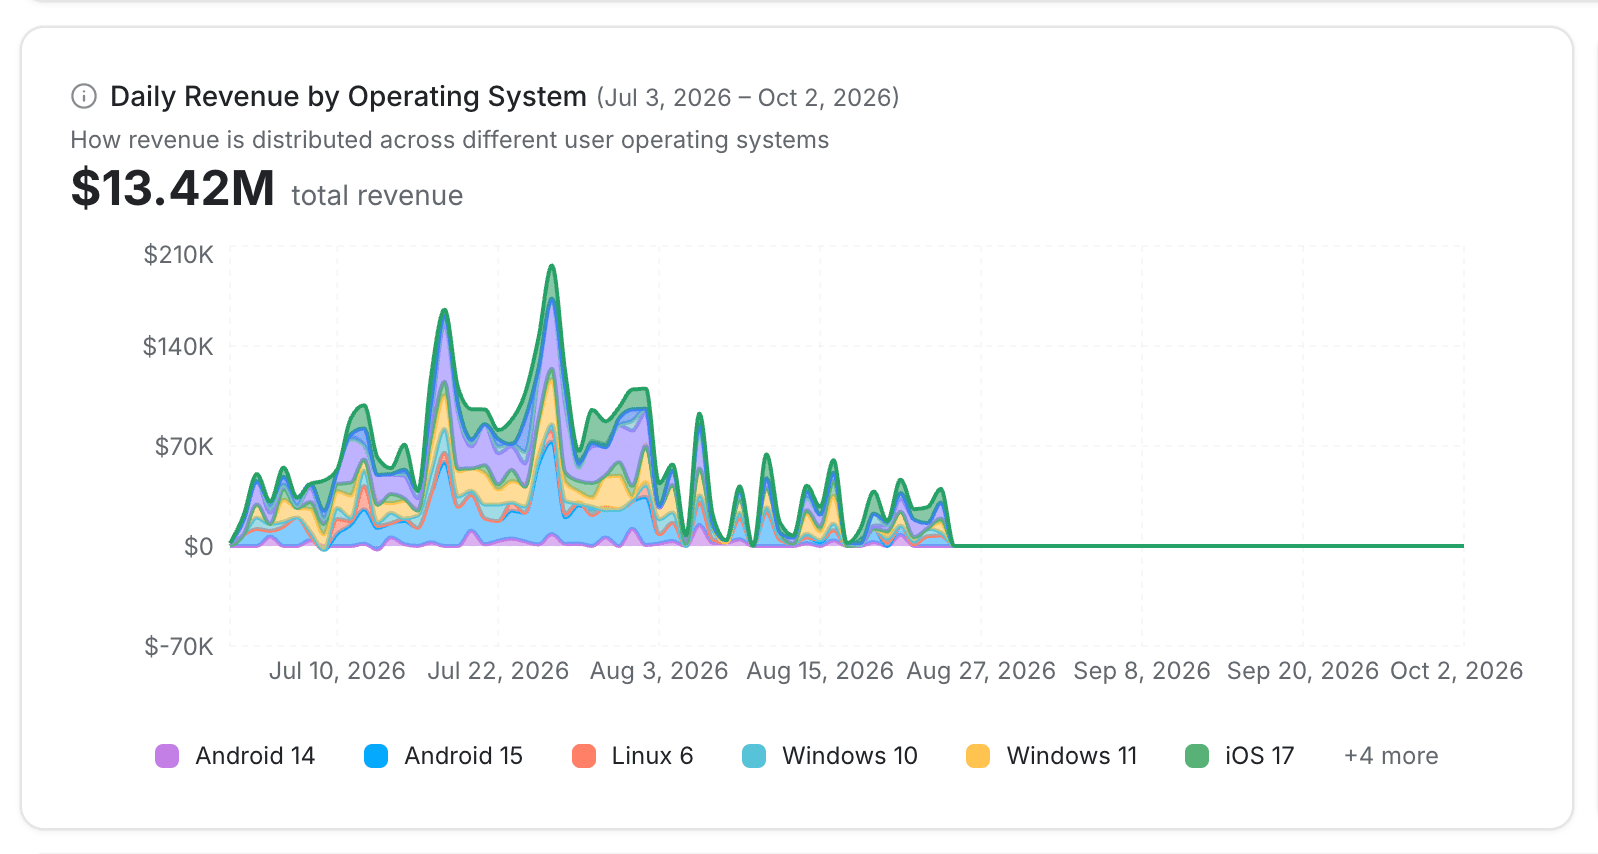
- Daily Revenue by Operating System. Revenue split by the operating system the purchase came from, as a stacked area chart, useful for spotting whether iOS, Android, or desktop customers are worth more to you.
- Revenue by RFM Segment. Revenue split by customer segment, Champions, Promising, New Customers, At risk, and others, based on how Recently, how Frequently, and how much a customer has spent. Shows which segment is actually driving revenue, not just headcount.
- Purchase Paths. A row-by-row table of individual purchases, who bought, their country, device, browser, which UTM source brought them in, how long their session lasted, and how much they spent. The closest thing to a raw purchase log on this board.
Engagement
- Page Views. A trend of total page views over the period, your baseline volume number, with a percentage change against the prior period of the same length shown right alongside it.
- Sessions. A trend of total sessions, distinct visits, as opposed to raw page views.
- Active Users. A trend of how many distinct users were active in the period.
- User Retention. How many users from a given period come back and stay active in later periods, engagement's own retention curve.
- Session Duration. A bar chart grouping sessions into duration buckets. A spike in very short sessions is worth a look, it can point to a broken page or a confusing flow.
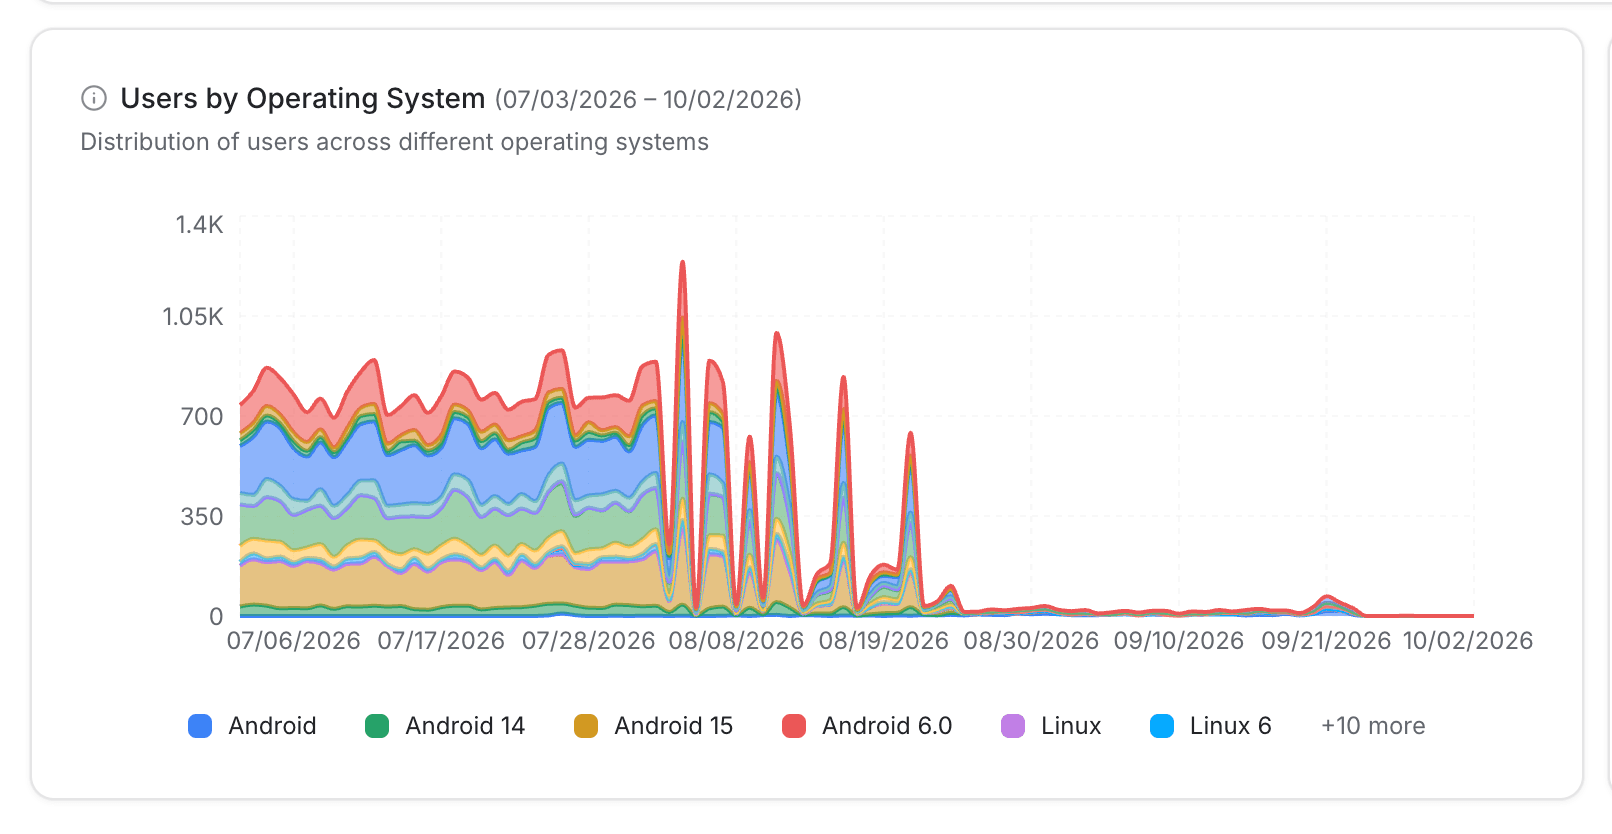
- Users by OS. Active users split by operating system.
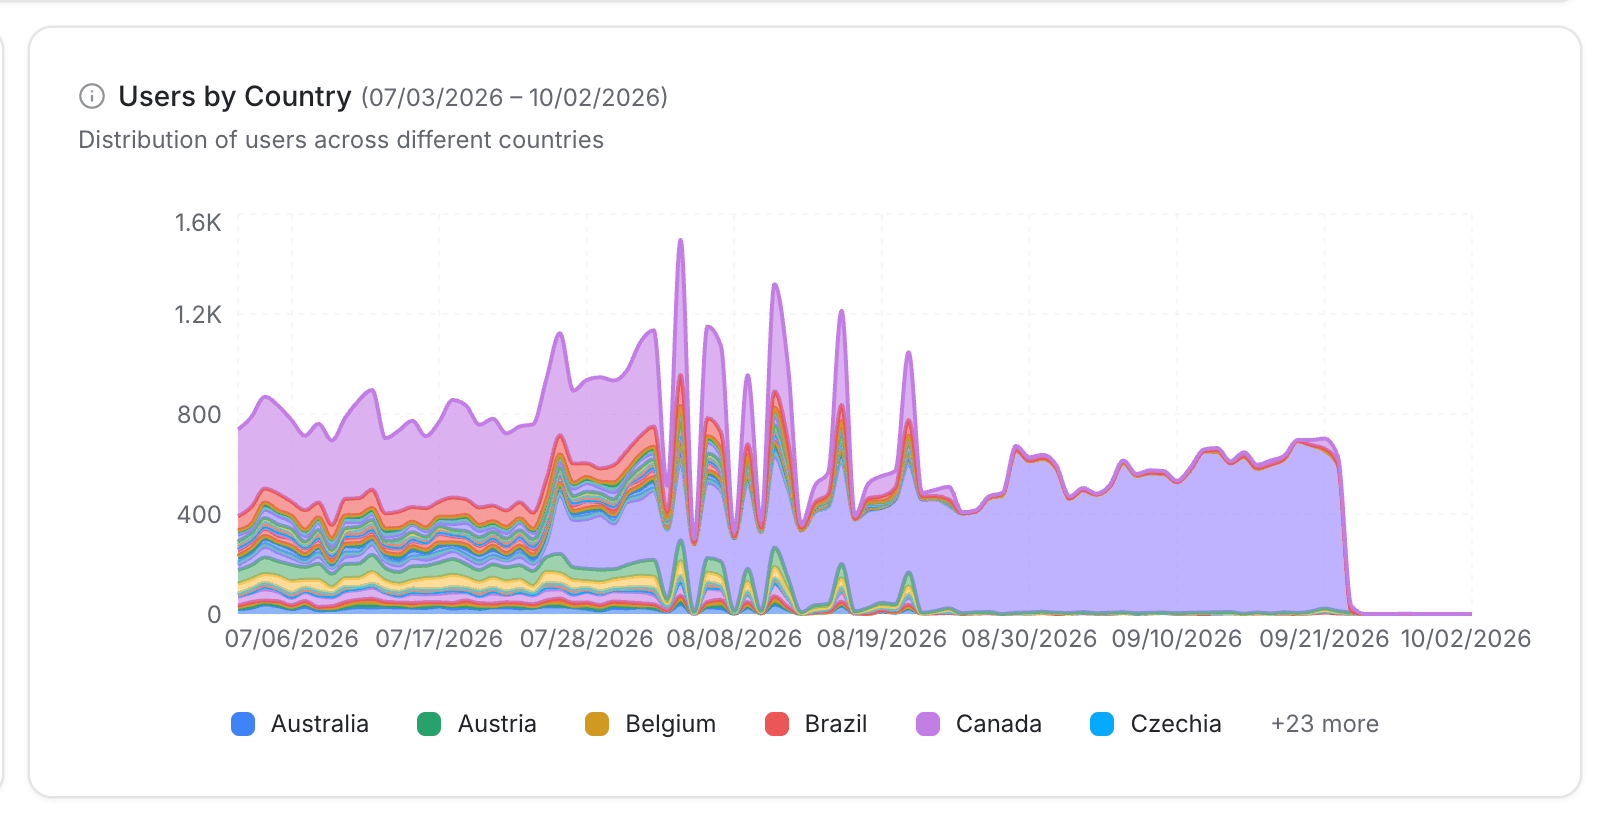
- Users by Country. Active users split by country, as a stacked area chart over time.
💡 Good to know
A handful of cards (User Retention, Users by OS, Users by Country on Engagement; Revenue by RFM Segment on Revenue) can show "No data available" even on an active project, this is a known gap in a couple of backend endpoints, not a sign nothing happened. If a card you'd expect to be populated looks empty, it's worth double-checking rather than assuming there's no underlying activity.
Where to go next
- Analytics for what reports and dashboards do and which report type to reach for.
- Subscription analytics for the other out-of-the-box board, your own Stripe-based subscription revenue.
- Building a dashboard for a board you configure yourself.
Subscription analytics
The Subscription board tracks your organization's own subscription revenue: MRR, subscriber counts, churn, plan mix, and trial conversion, synced from Stripe.
Catalog
Browse the product data Intempt syncs from your eCommerce integration or custom catalog sources, and inspect any single product's details.