
Creating a retention report
Retention reports show how many users return and repeat an event after their first interaction, grouped by day, week, or month.
Overview
Retention reports show how many users return and repeat an event after their first interaction with your product, grouped by day, week, or month. Use them to see how long users stay engaged, when drop-off happens, and which cohorts retain best.
Use cases
- Engagement over time. See what percentage of new signups are still active a week or a month later.
- Comparing cohorts. Add a breakdown to see which signup channel, plan, or onboarding flow retains best.
- Picking the right cadence. Match the retention window to how often people should realistically use your product, daily for a habit-forming app, monthly for something used less often.
- Spotting the drop-off point. Read the cohort table across periods to see exactly where engagement falls off.
Quick start
-
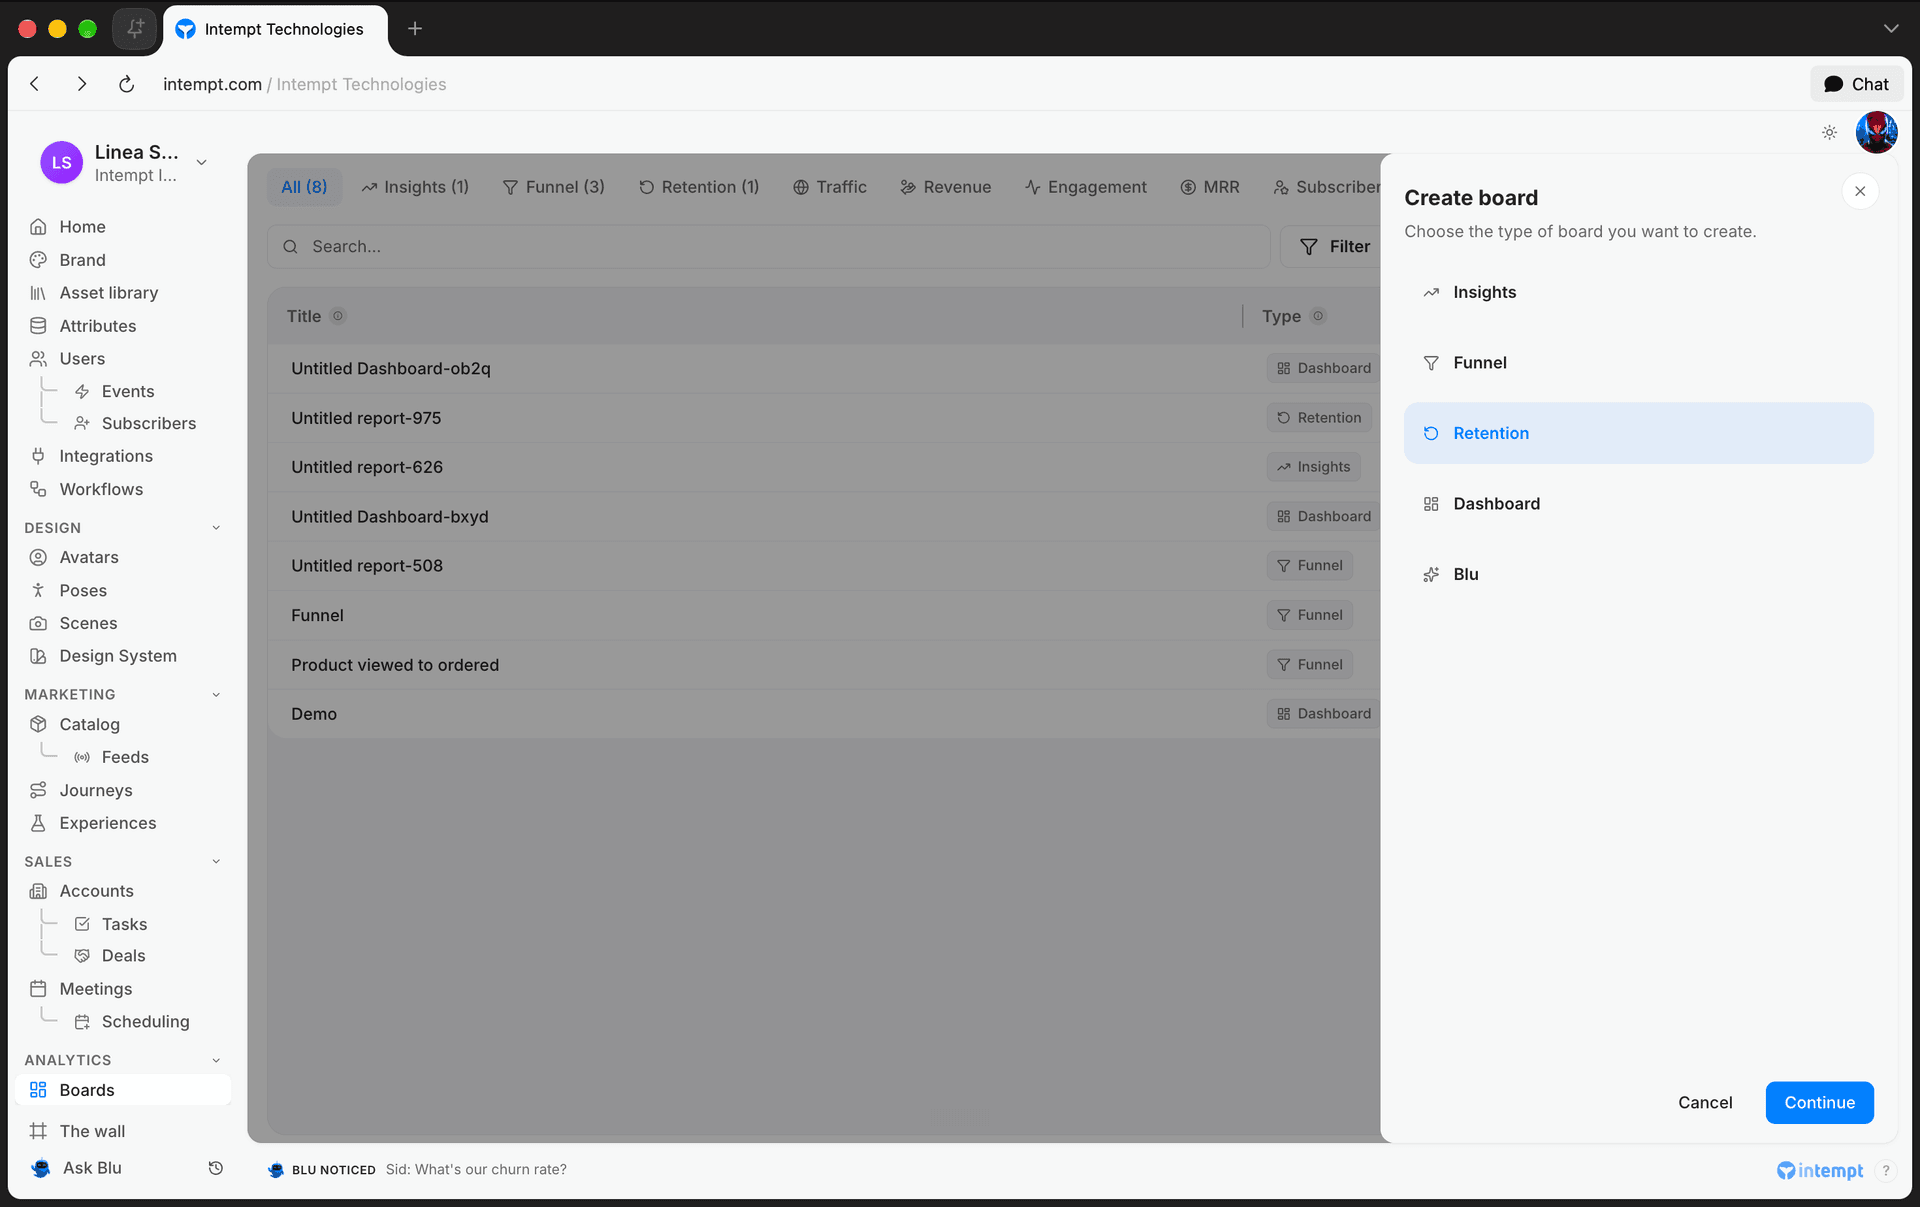
Open the Analytics group in the sidebar and click Boards. Click Create board, pick Retention, then click Continue.
-
Pick an anchor event (what starts the cohort) and a return condition (what counts as coming back).
-
Set the retention window, Daily, Weekly, or Monthly, to match your product's usage cycle.
-
Optional: narrow it with a filter, or add a breakdown to compare segments.
-
Review the retention curve and cohort table.
That's a working Retention report. The sections below cover every option in more depth.
Building it step by step
Selecting events
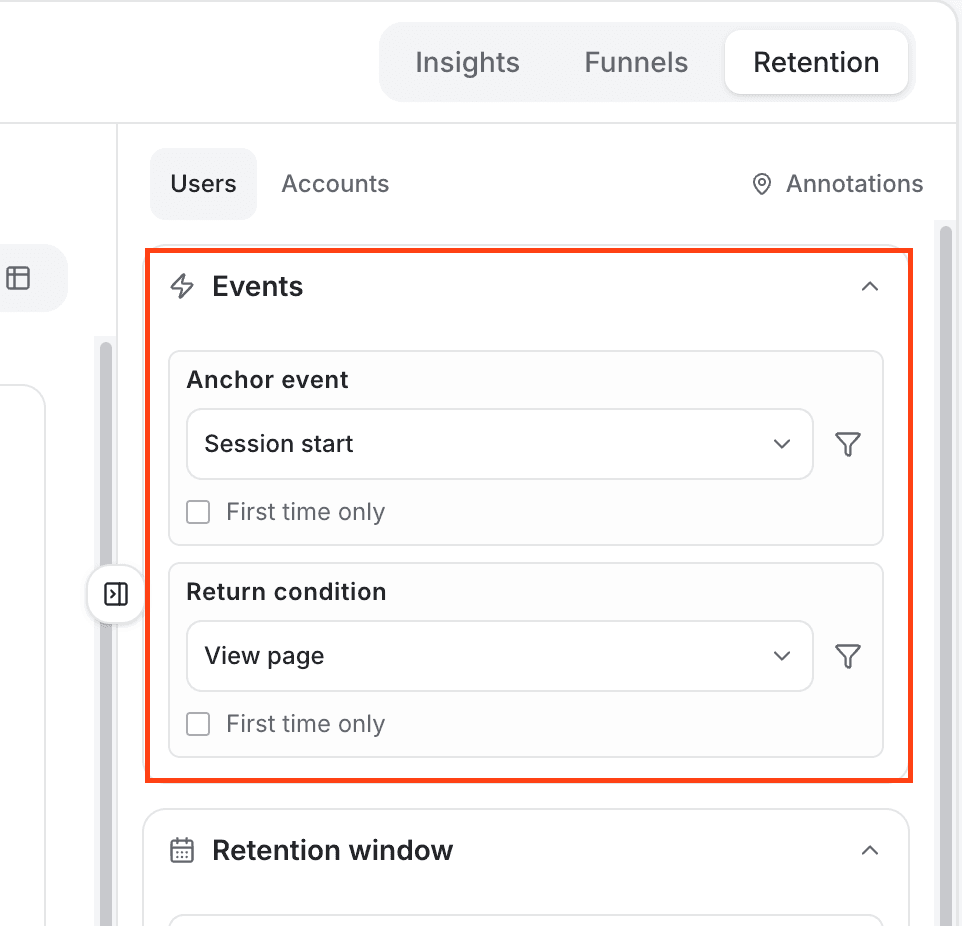
A retention report is built from two events:
- Anchor event. The event that starts the cohort, for example Sign Up.
- Return condition. The event a user must repeat to count as retained, for example Product Viewed.
For each event:
- Select an event from the dropdown.
- Click the filter icon next to the event to add an event-level filter, if needed.
- Check First time only to count just a user's first occurrence of that event, instead of any occurrence.
Setting the retention window
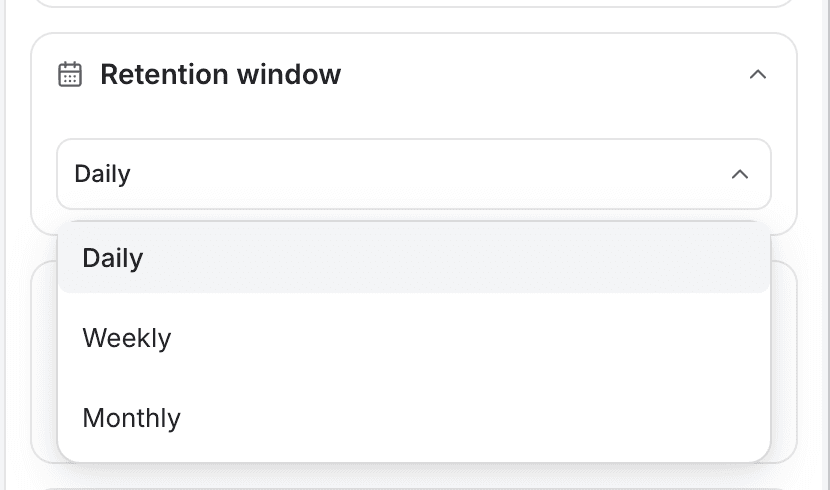
The Retention window setting groups cohorts and measures return activity by Daily, Weekly, or Monthly periods.
- Daily. Tracks whether users return each day after their anchor event.
- Weekly. Tracks whether users return each week.
- Monthly. Tracks whether users return each month.
Match this to your product's usage cycle, daily for apps used every day, weekly or monthly for less frequent products.
Setting the measuring method
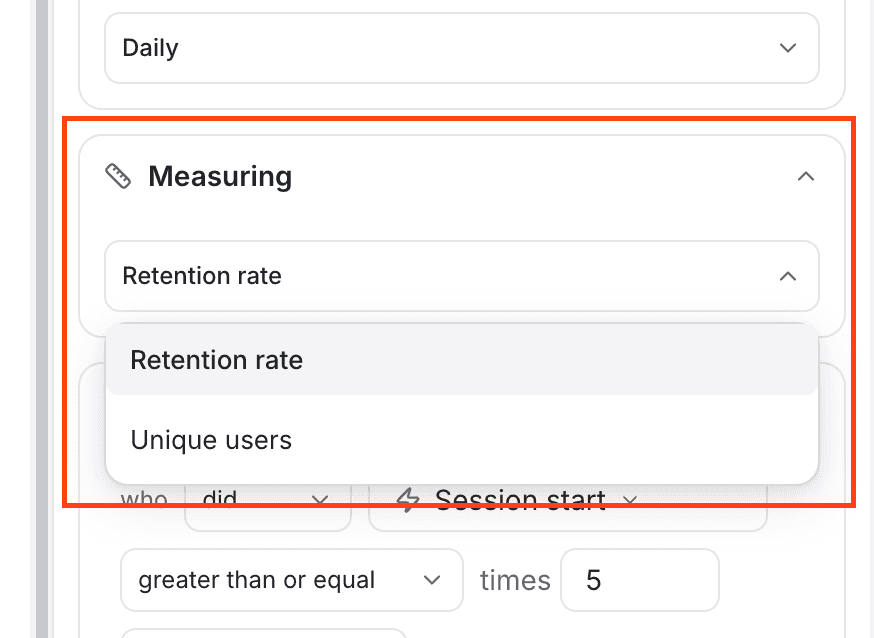
Under Measuring, choose how return activity is quantified:
- Retention rate. The percentage of the original cohort that returned in each period.
- Unique users. The raw number of users who returned in each period.
Applying filters (optional)
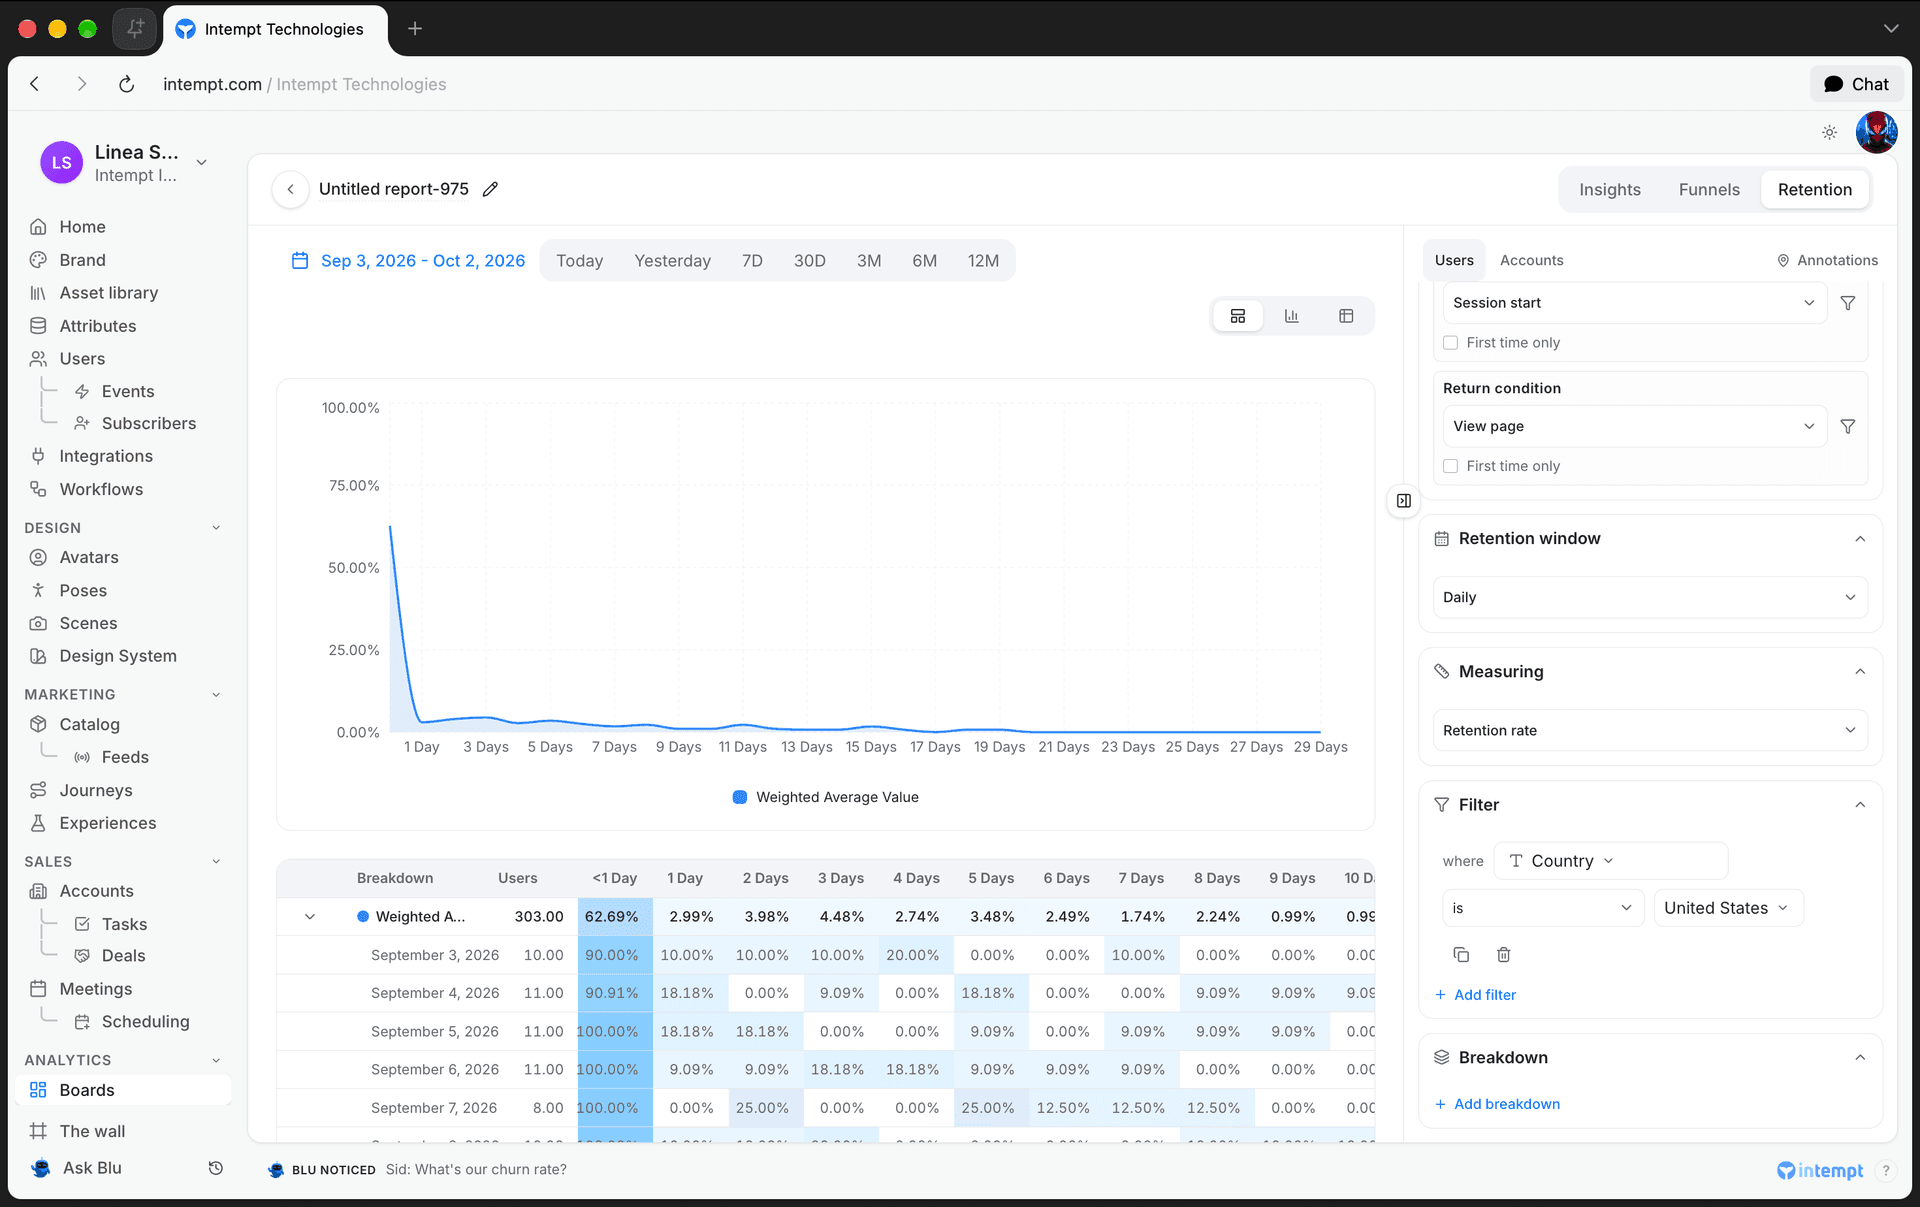
Open Filter to narrow the report to a subset of users. Filters apply globally across both events and can match on event attributes, user attributes, account, deal, and task attributes, or segments.
Adding breakdowns (optional)
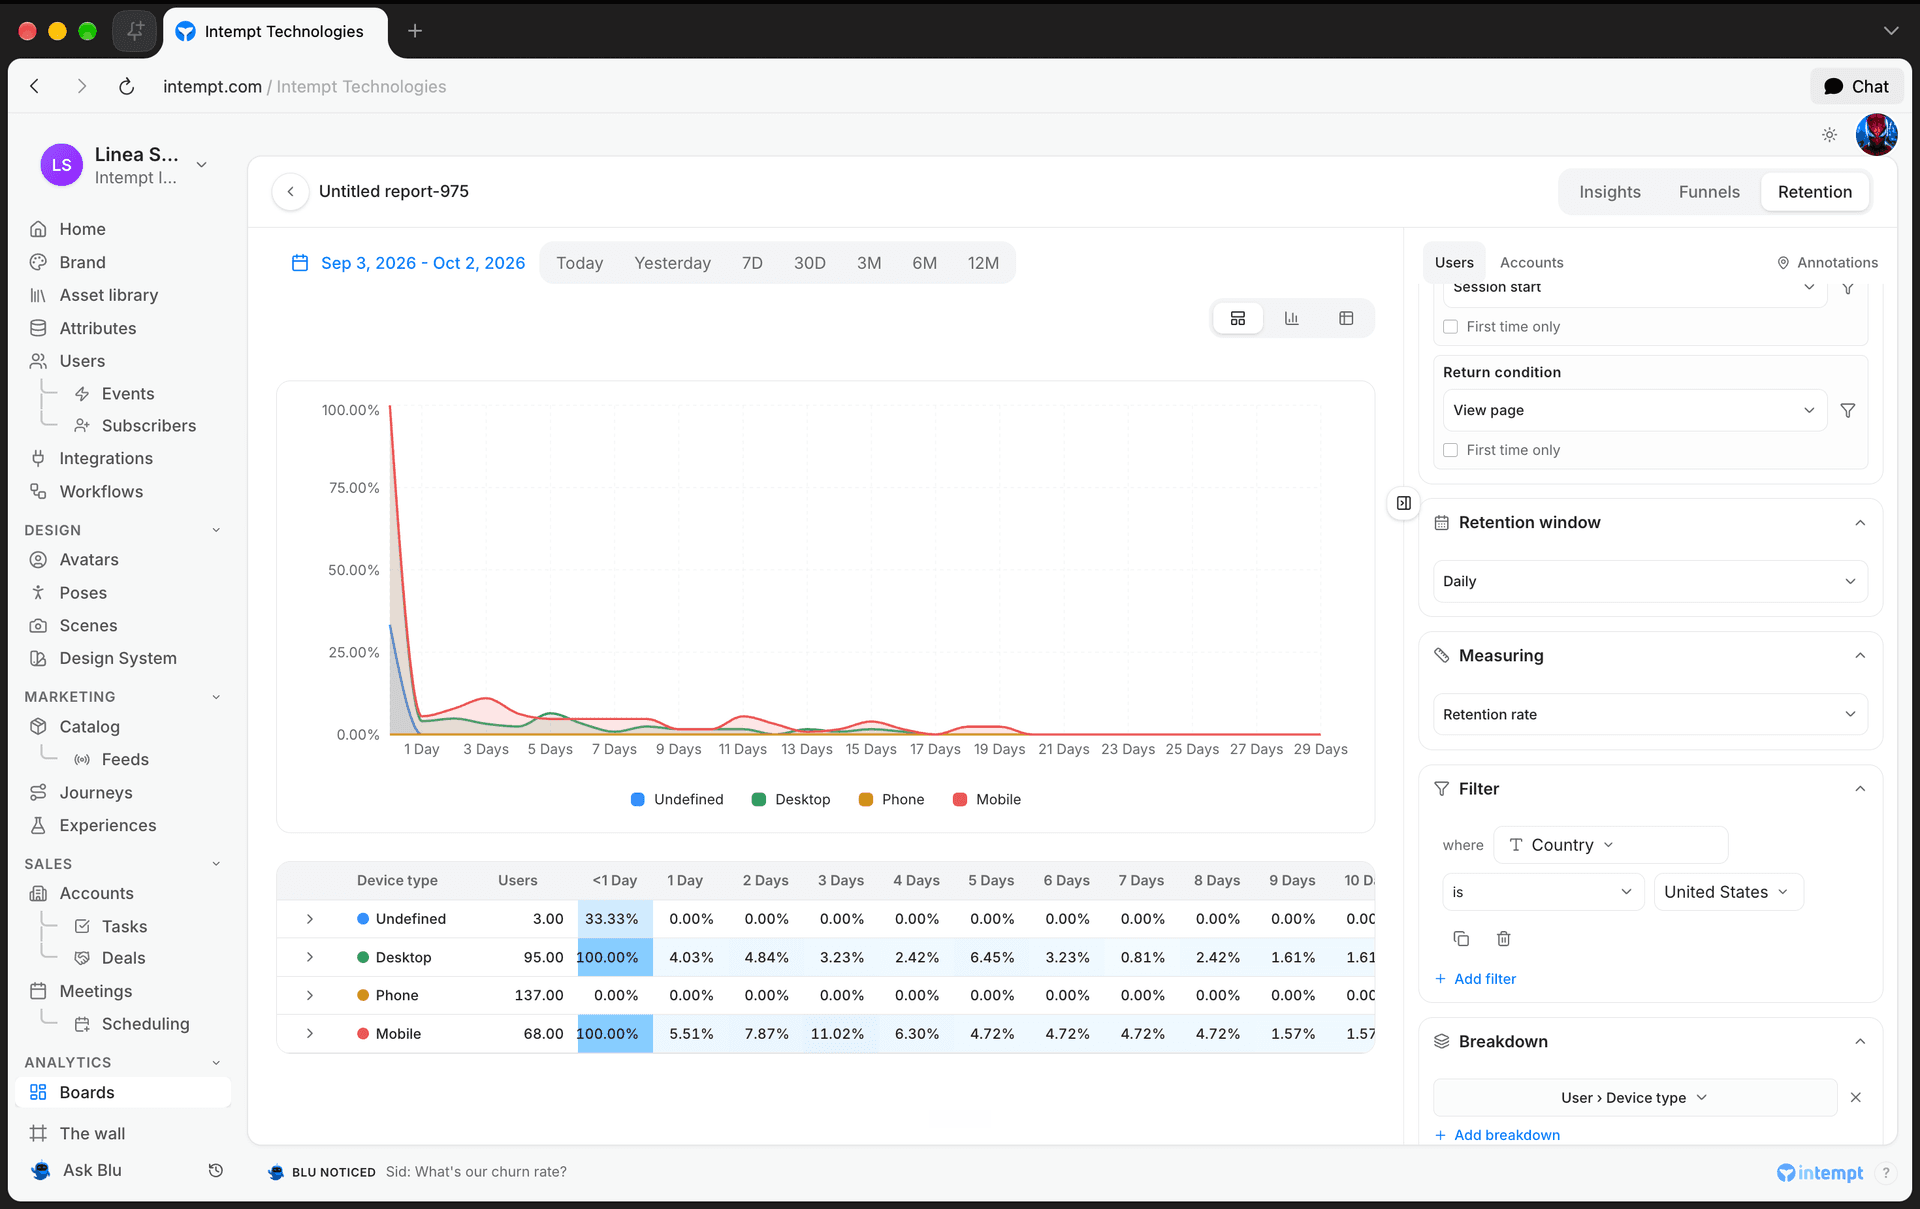
Open Breakdown to split cohorts into groups by attribute, event property, or segment. You can add up to two breakdowns per report. Each group shows as its own row in the table and its own line in the chart.
Reading the results
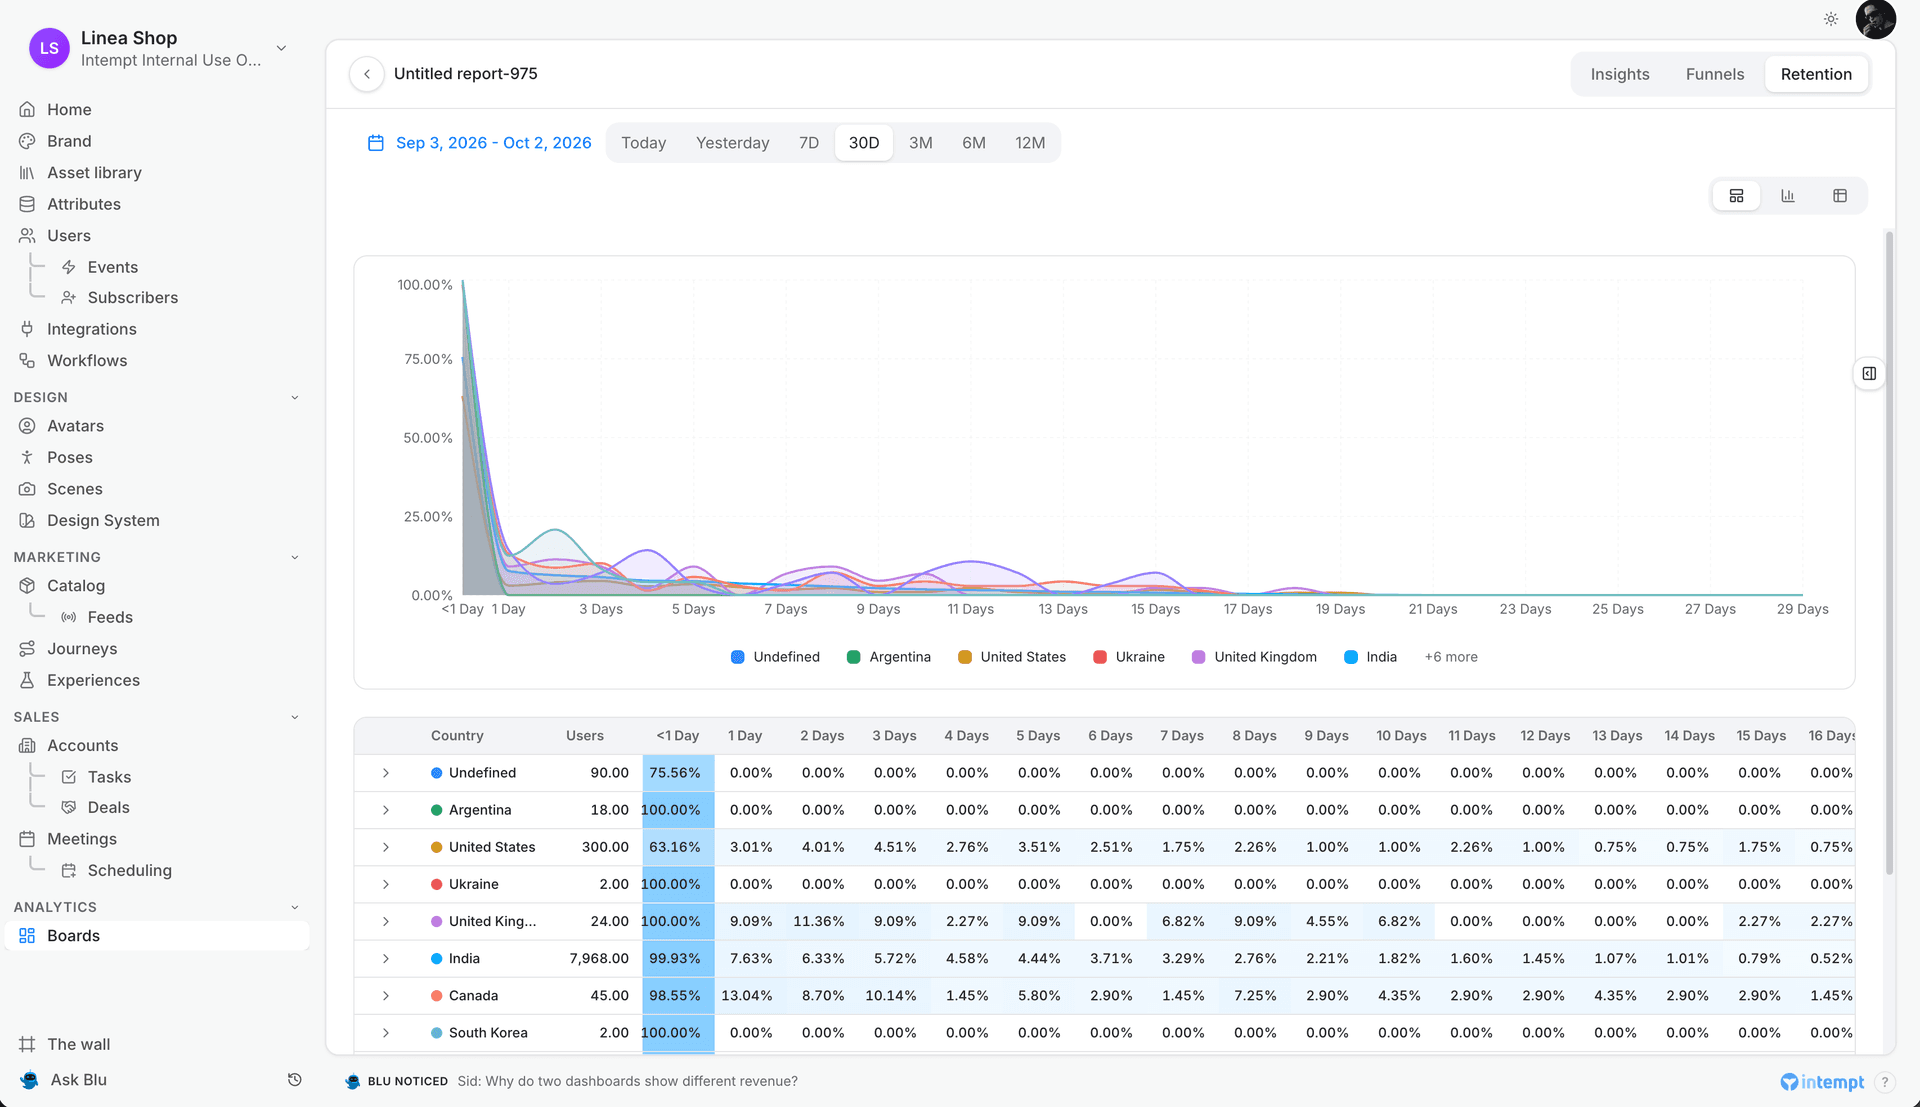
Once both events are selected, Intempt generates the retention chart and table.
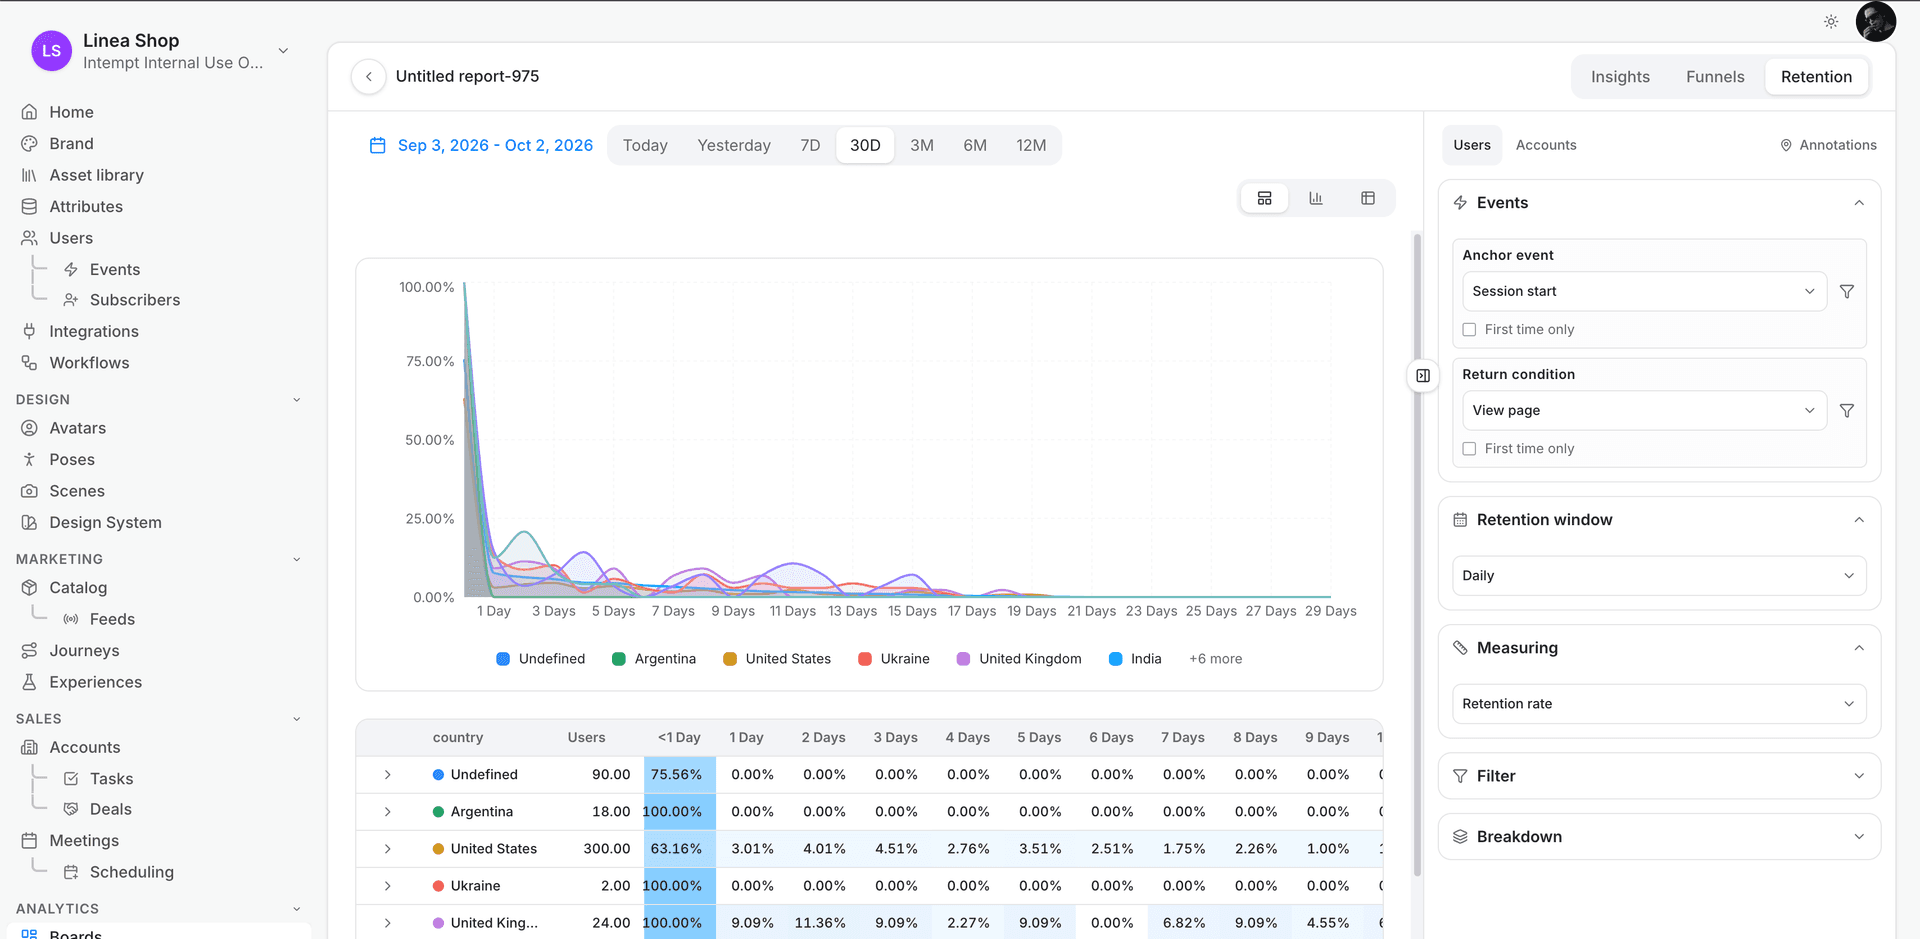
- Chart. A retention curve, a line chart plotting the percentage (or count, depending on your measuring setting) of users who returned in each period. Unlike Insights and Funnel reports, there's no chart type selector, Retention always renders as this curve. If breakdowns are applied, each group gets its own colored line.
- Table. A heatmap with one row per cohort, a Users column showing the cohort size, and one column per period. When measuring by retention rate, cells shade darker as the percentage increases. If a breakdown is applied, cohorts are grouped by segment, and each segment's row header has an arrow to expand and collapse its cohorts.
Where to go next
- Analytics for what reports and dashboards do and which report type to reach for.
- Creating a funnel report to measure step-by-step conversion instead of return behavior.
- Creating an insights report to analyze trends and event volume.
- Dashboards to add this report to a shared board.