
Building a Custom Report with Blu
Ask Blu a question about your data that doesn't fit an existing report type, and it composes a new analysis for you, rendered inline as a chart, table, or metric.
Overview
Ask Blu a question about your data, and if it matches an existing report type, an Insights, Funnel, or Retention report, Blu answers using that same engine. If it doesn't match any of those, Blu composes a new analysis instead and renders the result inline in the chat as a chart, table, or single metric.
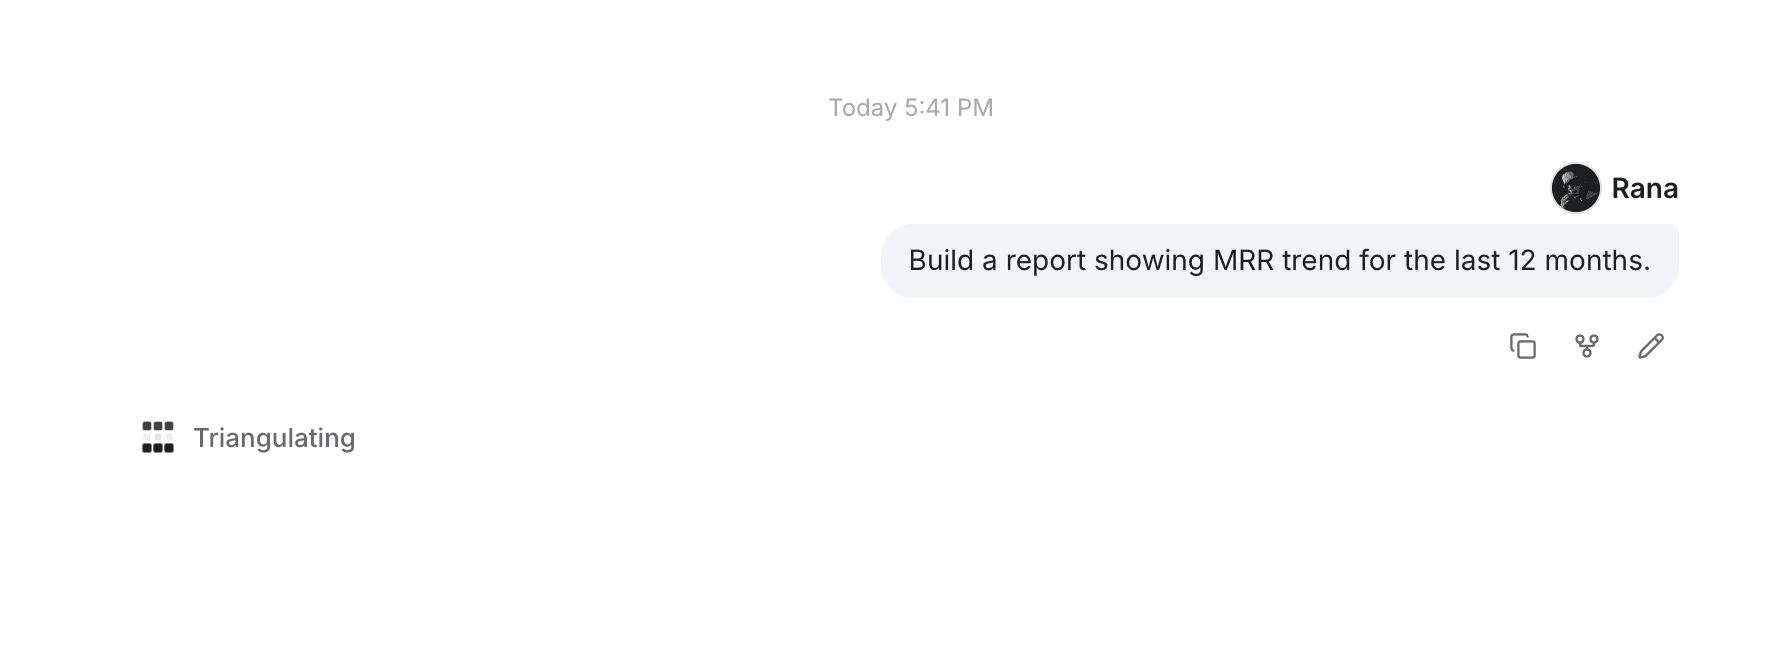
For example: "Build a report showing MRR trend for the last 12 months."
How it works
Asking a question
If your question is ambiguous, Blu asks a clarifying question with a set of options and a default, rather than guessing. The same happens if your question references an event, property, or value Blu doesn't recognize. While Blu works, a status label shows what it's doing, for example "Triangulating...". Once the result lands, expand the trace to see how many stages it ran and how long each one took.
What you get back
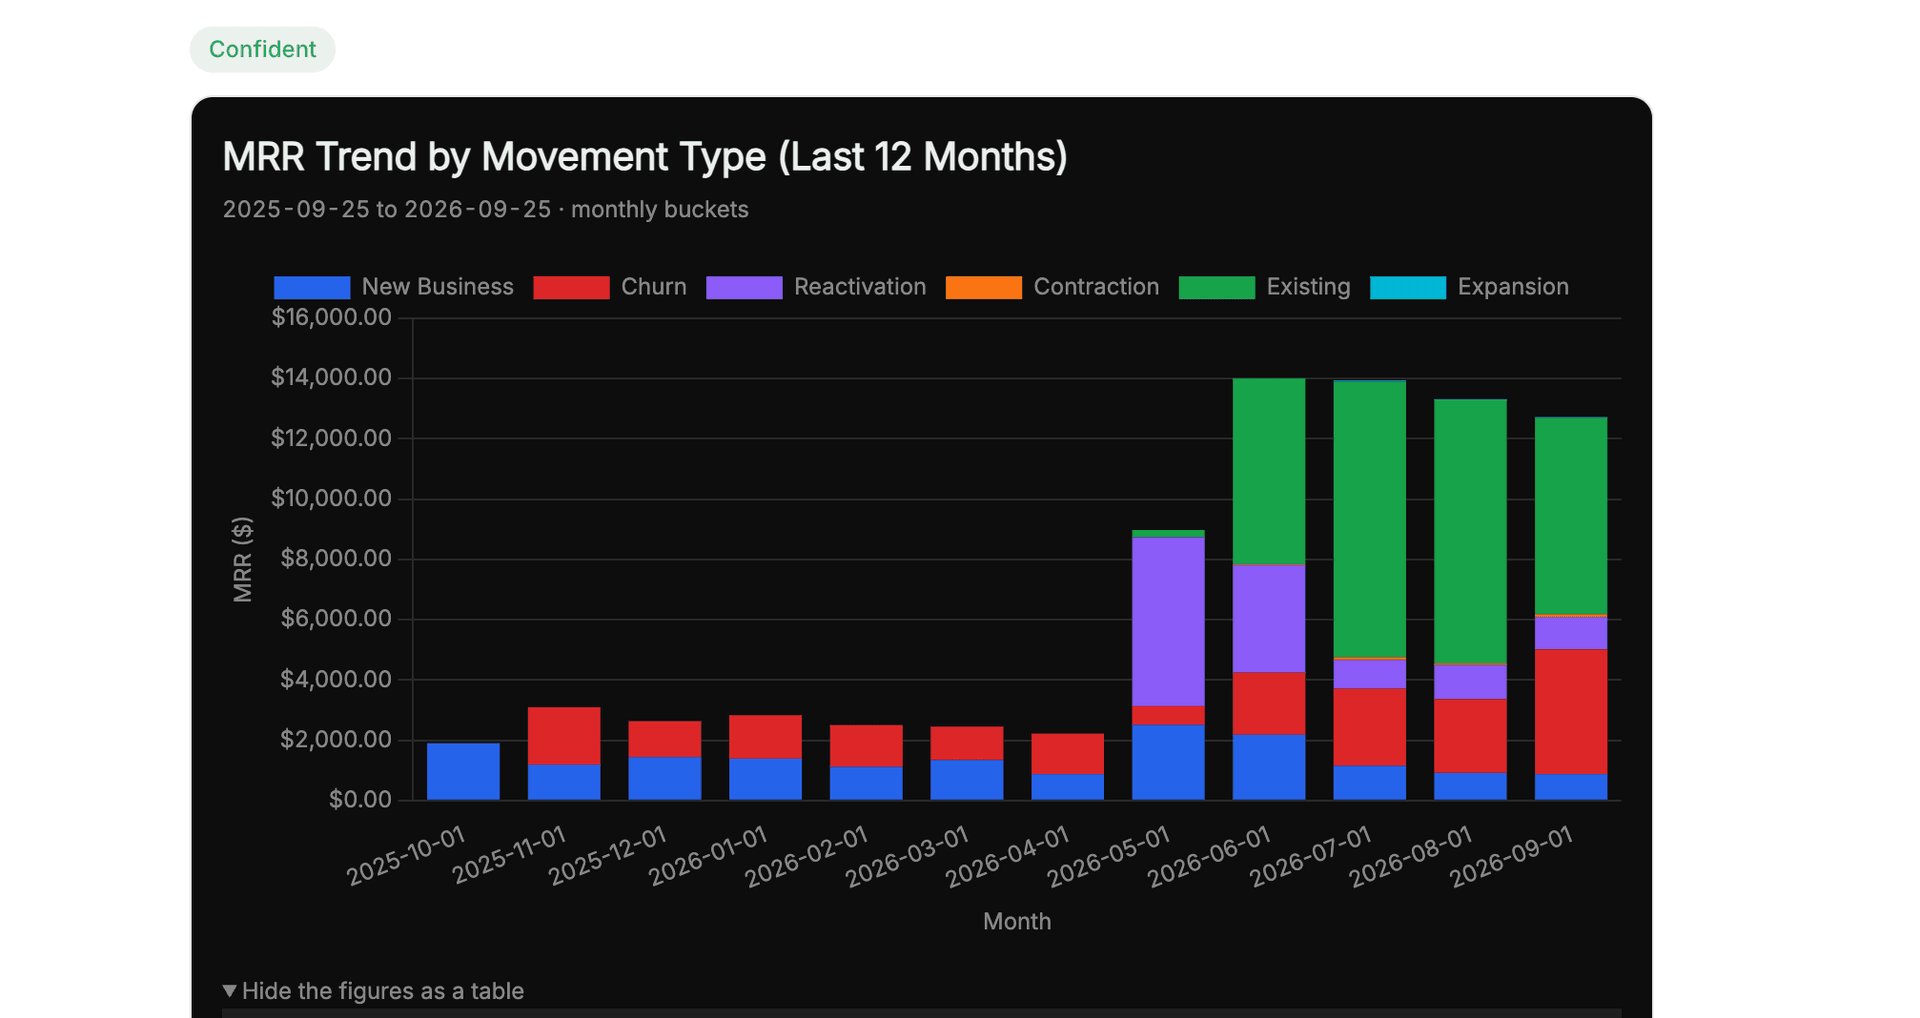
Every result renders as a chart, table, or single metric, along with a short AI Insight line summarizing what it found. Each result carries a data-freshness "as of" stamp and is labeled confident, qualified, or declined. If there's no data for your question, Blu says so plainly instead of guessing at an answer. If the underlying engine is down, it declines gracefully instead of hanging. Small-cohort results are suppressed to protect individual privacy.
Figures, Export, Embed, and Save
Every result comes with four actions:
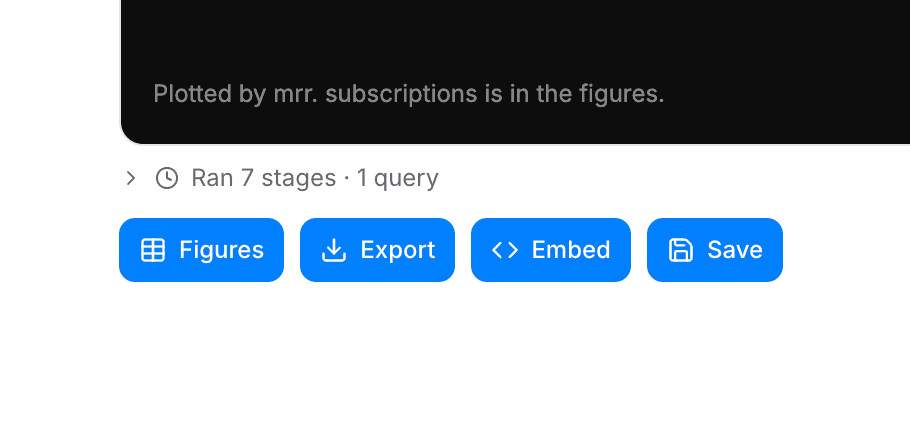
- Figures toggles the result to a table view.
- Export downloads it as CSV, PNG, or PDF.
- Embed creates a shareable public link to the result, which you can copy, extend, or revoke later.
- Save keeps the report so you can come back to it later. Saving is a distinct, explicit action, separate from just asking the question. A saved report keeps its original definition and re-runs live with fresh data every time you open it, it isn't a frozen snapshot of the moment you saved it, and it gets its own read-only detail page. You'll also find it later under the Blu tab on the Analytics Boards list, alongside your Insights, Funnel, and Retention reports.
💡 Good to know
This is the ad-hoc question-and-answer flow. Adding a saved report to a dashboard isn't part of this flow yet.
Getting started
- Open Blu Chat.
- Ask your question about your data in plain language.
- If Blu asks a clarifying question, pick an option or accept the default.
- Review the result: the chart, table, or metric, plus the AI Insight line underneath it.
- Use Figures, Export, Embed, or Save to work with the result. Save keeps it so you can come back to it later; it re-runs with fresh data every time you open it.
Use cases
- Getting a quick answer without building a report by hand. Ask a one-off question instead of configuring an Insights report from scratch.
- Handling an ambiguous question safely. Blu asks a clarifying question instead of guessing when a metric name could mean more than one thing.
- Reusing a saved answer. Save a report once, and it re-runs with fresh data instead of you re-asking the same question every time.
- Pulling a result into another tool. Export the report as CSV, PNG, or PDF instead of rebuilding it elsewhere.
- Sharing a link instead of a file. Use Embed to hand someone a public URL to the result, and revoke it later if you need to.
- Flipping between chart and table. Click Figures to check the underlying numbers without leaving the result.
Where to go next
Drafting Emails and Replies with Blu
Blu triages your inbox, drafts replies for emails that need one, and generates outreach email you can send from a prospect's profile.
Generating Meeting Summaries
Intempt's meeting bot joins and records your calls, and Blu generates an AI summary from the recording that you can customize, switch types, or regenerate section by section.