You track pageviews, funnels, and MRR.None connect a click to a dollar.
Revenue, web, and product analytics on one identity graph. See what moved and why without SQL.
 0.0on G2
The category: Revenue Attribution
Three blind analytics layers. Google Analytics tracks pageviews. Amplitude tracks funnels. ChartMogul tracks MRR. Not one connects a click to a dollar. You know THAT revenue moves - not WHY.
Revenue, web, and product analytics on one identity graph. First touch to final dollar. Dashboards live in minutes, the Data Analyst explains every driver.
GA tracks pageviews. Amplitude tracks funnels. ChartMogul tracks MRR. None connect a click to a dollar.
Hire a data analyst to build reports nobody reads.
Pay a consultant $5K to tell you what your own data means.¹
Screenshot a chart. Paste it in Slack. Argue about what it means.
Churn surprises you at the end of the quarter.
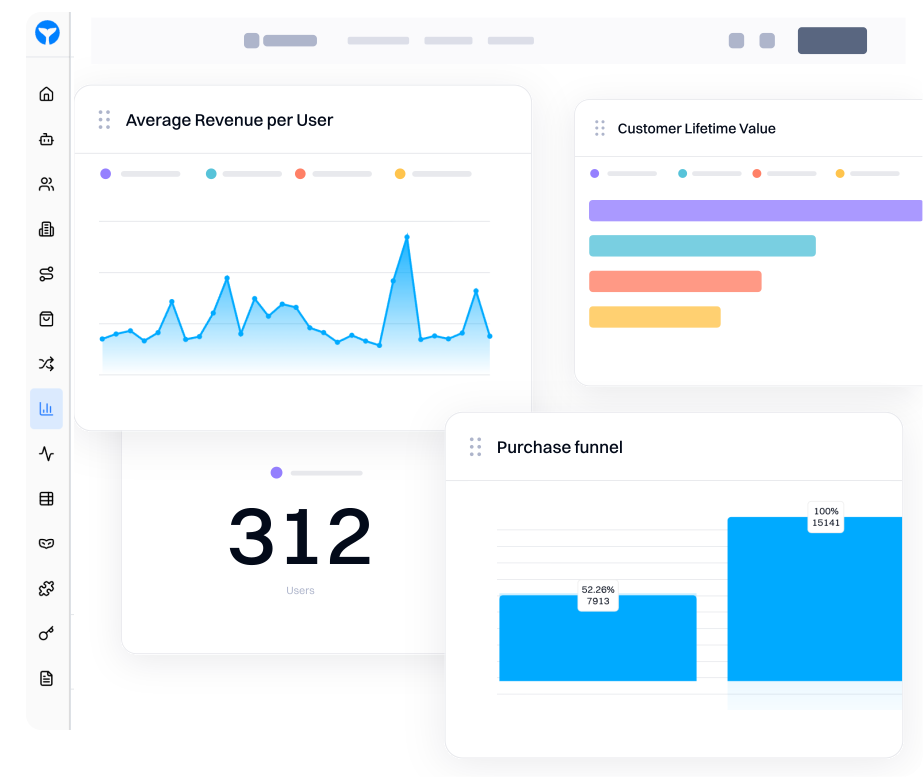
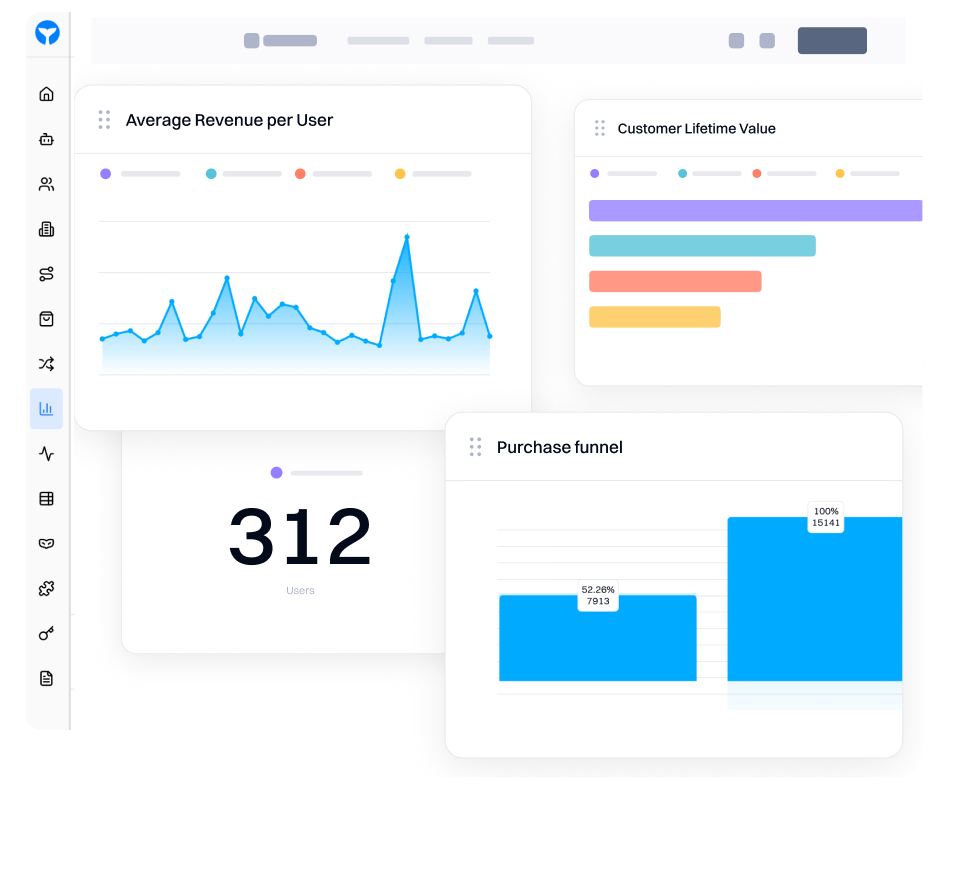
One snippet. Revenue, web, and product analytics on one identity graph.
Click any number. See the actual people behind it.
Ask Blu. Get the answer and the fix in one sentence.
The Data Analyst writes the weekly summary. Flags what changed. Says why.
Every user scored 0-100 for churn risk. Updated live.
THE OFFER
Here's what this would cost you the old way.
Total value
$0
Your price
$0
One snippet. Every dashboard live. The Data Analyst explains the why. Free.
No credit card required
The platform your data team was supposed to build
Revenue, funnel, retention, channel dashboards
Pre-built, live on arrival
Click any metric to see the users
Not percentages. Actual people.
Auto-capture with one snippet
No event taxonomy to define upfront
Segment builder + 100K events/mo
Rule-based segments, auto-updating
The consultant you were about to hire
Churn risk scores (0–100)
On every user, updated live from behavior
RFM segmentation
Champions → Lost, auto-classified
The Data Analyst explains why metrics moved
Ask a question, get the driver
Top fixes ranked by dollar impact
Highest-impact moves first
First touch to final dollar. Every metric explained.
Dashboards, insights, funnels, retention, and paths on one identity graph. The Data Analyst connects the click to the dollar and explains every driver.
Ask a question.
Get the dashboard and the answer.
Describe what you want to know in plain language. The Data Analyst reads your live data, builds the view, identifies the specific driver behind any metric movement, and ranks fixes by dollar impact.
Ask a question, get a live dashboard - not a static chart
The Data Analyst builds the view and keeps it updated
Every answer links to the user segment driving the change
Click through from insight to the people behind it
Fixes ranked by dollar impact so you know where to start
Highest-impact moves surfaced first
Built for the outcomes that matter.
Five analytics use cases teams run on Intempt.
Connect every trusted source.
Plug into the tools your team already runs on.
Certified & Compliant


Your customer data stays yours, and stays secure.
The teams that made the switch

We were losing visitors before they signed up. Intempt's personalized experiences changed that - we started meeting people where they were instead of guessing. Once they're in, Intempt's automated email takes over and keeps the relationship moving. Acquisition and retention finally feel like one connected motion instead of two separate problems.
Jim Stromberg, CEO
StockInvest
Case Study
StockInvest needed to turn anonymous traffic into registered users before any retention strategy could work. With Intempt's Experiences, they personalized the anonymous visitor flow, surfacing the right content and CTAs to boost signup conversion. Once users signed up, automated Journeys nurtured them through onboarding and deeper engagement, steadily increasing lifetime value.
Frequently asked questions
Everything you need to know before you sign up.
Dashboards, auto-capture, 100K events per month, the segment builder, and all platform features are free forever. Churn scoring, RFM segmentation, and Blu's AI explanations use credits. You get 15 weekly credits + 75 bonus on signup. Extra credits cost $0.12-$0.15 each via top-up (volume discount).
Sources
- 1.Cometly (2026), OuterBox. Project-based attribution audits range $2,500–15,000; at $150–300/hr, a $5,000 engagement ≈ 17–33 hours.
- 2.Fiverr, Careery, Upwork. Freelance analyst retainers for weekly reporting range $300–1,500/mo; 2–3 hrs/week at $50–100/hr.
- 3.Elevated Signal (2026), Clutch (2026), iKemo (2026). Done-for-you BI dashboard builds $5,000–25,000; basic analytics setup for small businesses $5,000–15,000. $2,000 reflects a lightweight single-dashboard engagement.
- 4.Fast Data Science, Reforge (2026). Custom churn prediction models typically 20–40 hrs of data science consulting at $100–250/hr ($2,000–10,000). SaaS churn tools (e.g. ChurnZero, Gainsight) start at $1,000–3,000/mo.
First touch to final dollar. One snippet.
The only analytics that connects a click to a dollar. Dashboards live in minutes, The Data Analyst explains every revenue driver. Free.