.svg)


How to go from insight to impact without report sprawl
Turn analysis into action with profiles you trust, core reports, one dashboard, and quick journeys or experiences to fix issues and prove what worked.
.svg)
Introduction to Executive Dashboard:
The Executive Dashboard SuccessBLOC allows you to:
What's Included?
Goals & KPIs
About the Growth Play
Most tools can show charts. Product Analysts need answers that change the product and the numbers. This Growth Play shows how to use GrowthOS to see Users and Accounts clearly, build the three core reports (Insights, Funnels, Retention), bring them together in a Dashboard, and then turn drop-offs or wins into action with Journeys and Experiences. The goal is a clean loop: understand → act → measure—without hopping across tools.
TL;DR- GrowthOS for Product Analysts
- One place to inspect Users and Accounts with events and activity history.
- Build Insights for feature adoption and usage by cohort.
- Build Funnels from signup → onboarding → activation → purchase.
- Build Retention to spot stickiness and churn patterns.
- Combine reports in a Dashboard with filters and breakdowns.
- When you see a problem or opportunity, launch a Journey or an Experience.
- Track impact in report trends and Journey/Experience analytics.
Result: Fewer reports, clearer decisions, faster product moves.
Benefits
- Clarity first: See who’s using what, when, and where they fall off.
- From charts to changes: Move straight from a finding to a test.
- Shared context: Users roll up to Accounts, so product and go-to-market see the same story.
- Less tool juggling: Analysis, action, and measurement live together.
- Proof of impact: Tie changes to activation, retention, and revenue.
How It Works
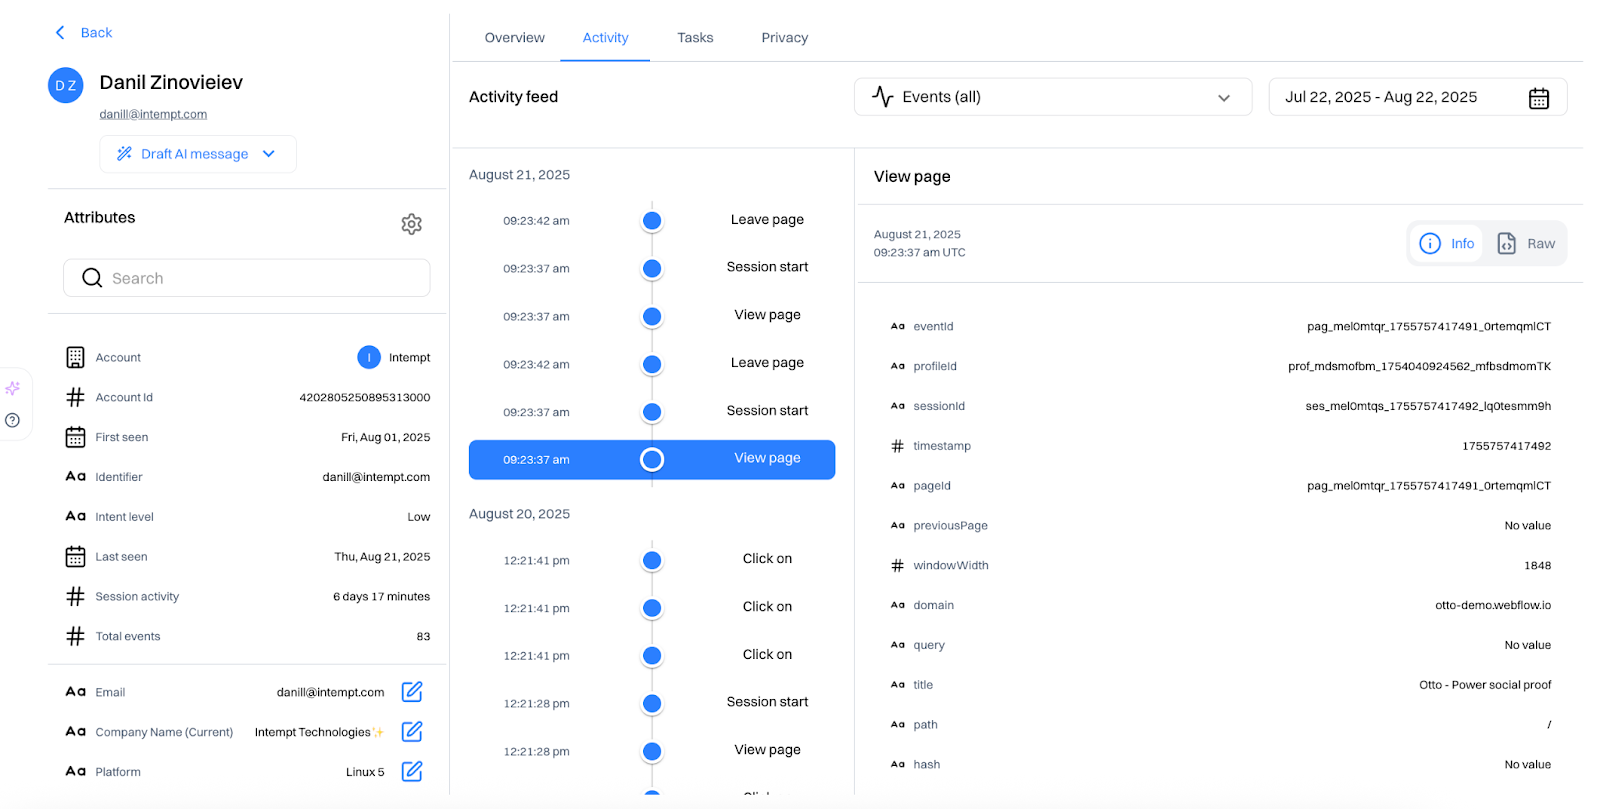
Step 1: Anchor on Users and Accounts
Open a few real profiles. Confirm you can see key actions and useful attributes. This is your ground truth for “who did what.”
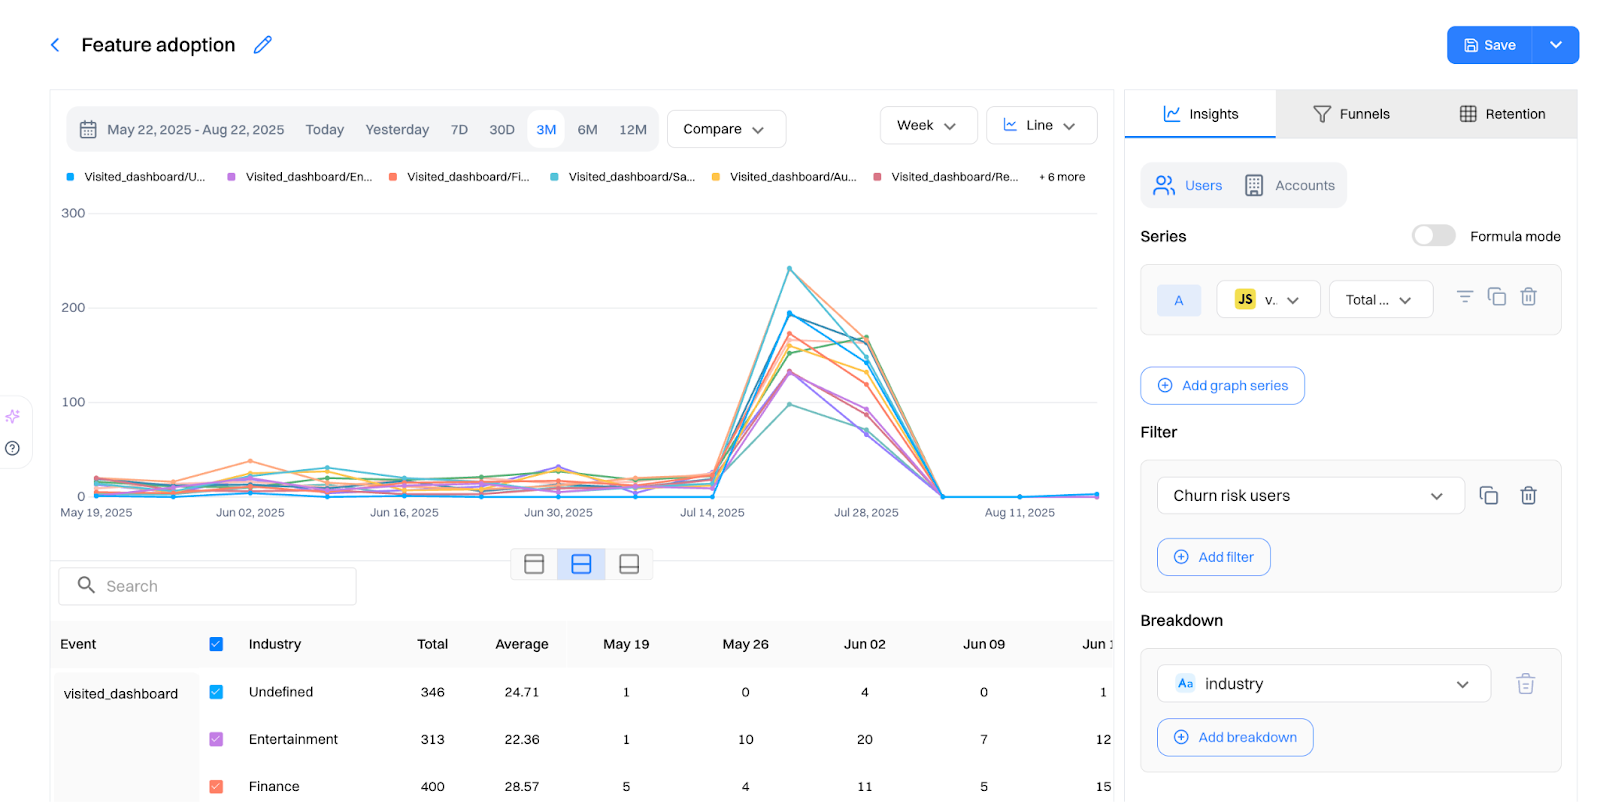
Step 2: Build an Insights report in Analytics
Track which features are used, by whom, and when. Add simple breakdowns (plan, lifecycle stage, geography) to find patterns worth testing.
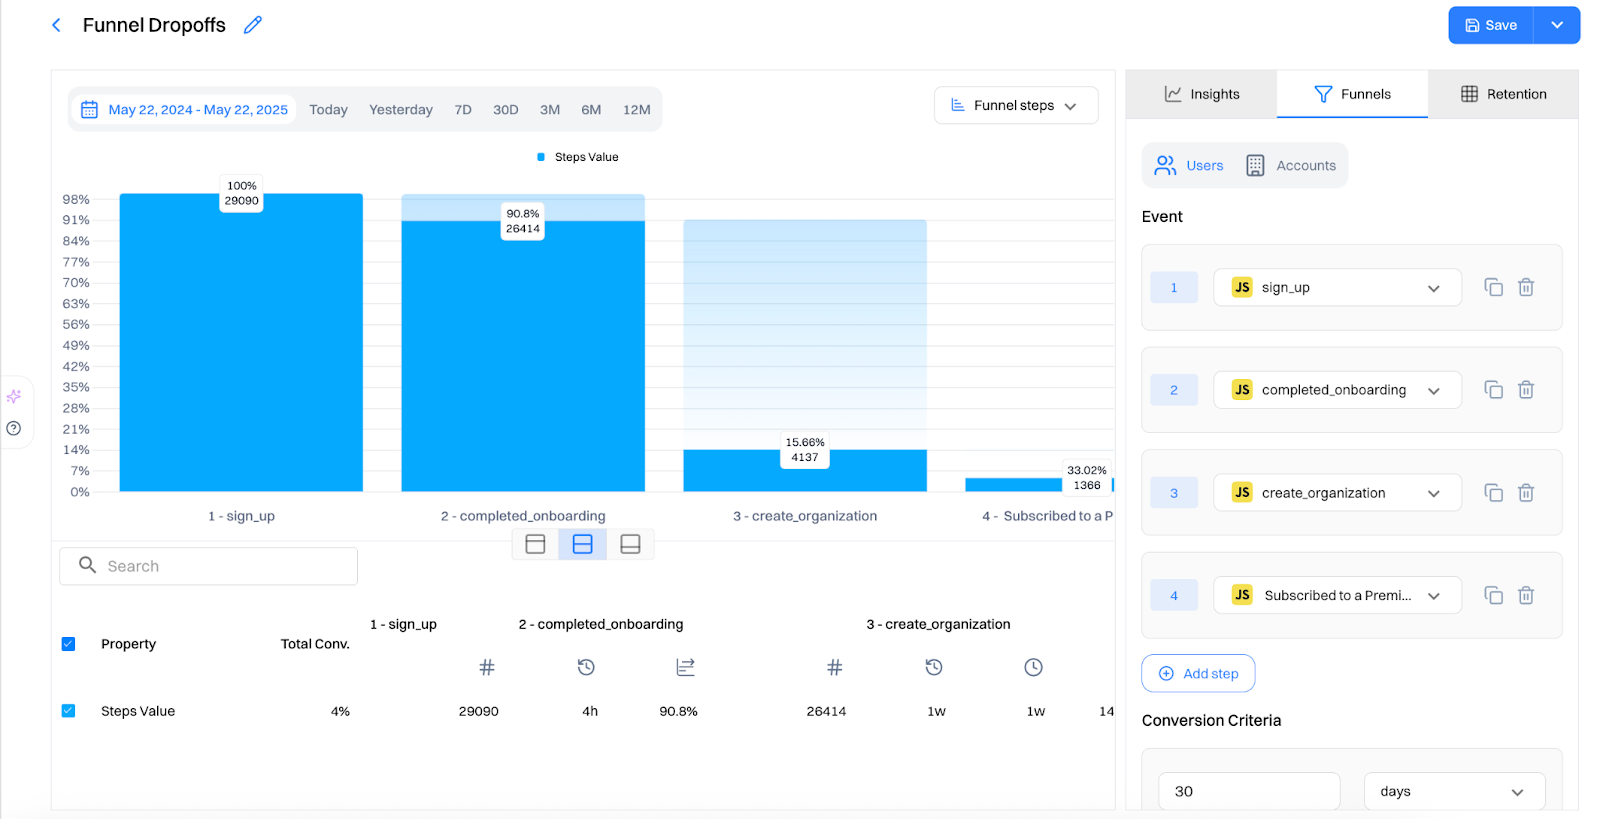
Step 3: Build a Funnels report in Analytics
Map the steps from signup to onboarding to activation to purchase. Compare drop-offs by device, plan, or campaign to find the highest-leverage fix.
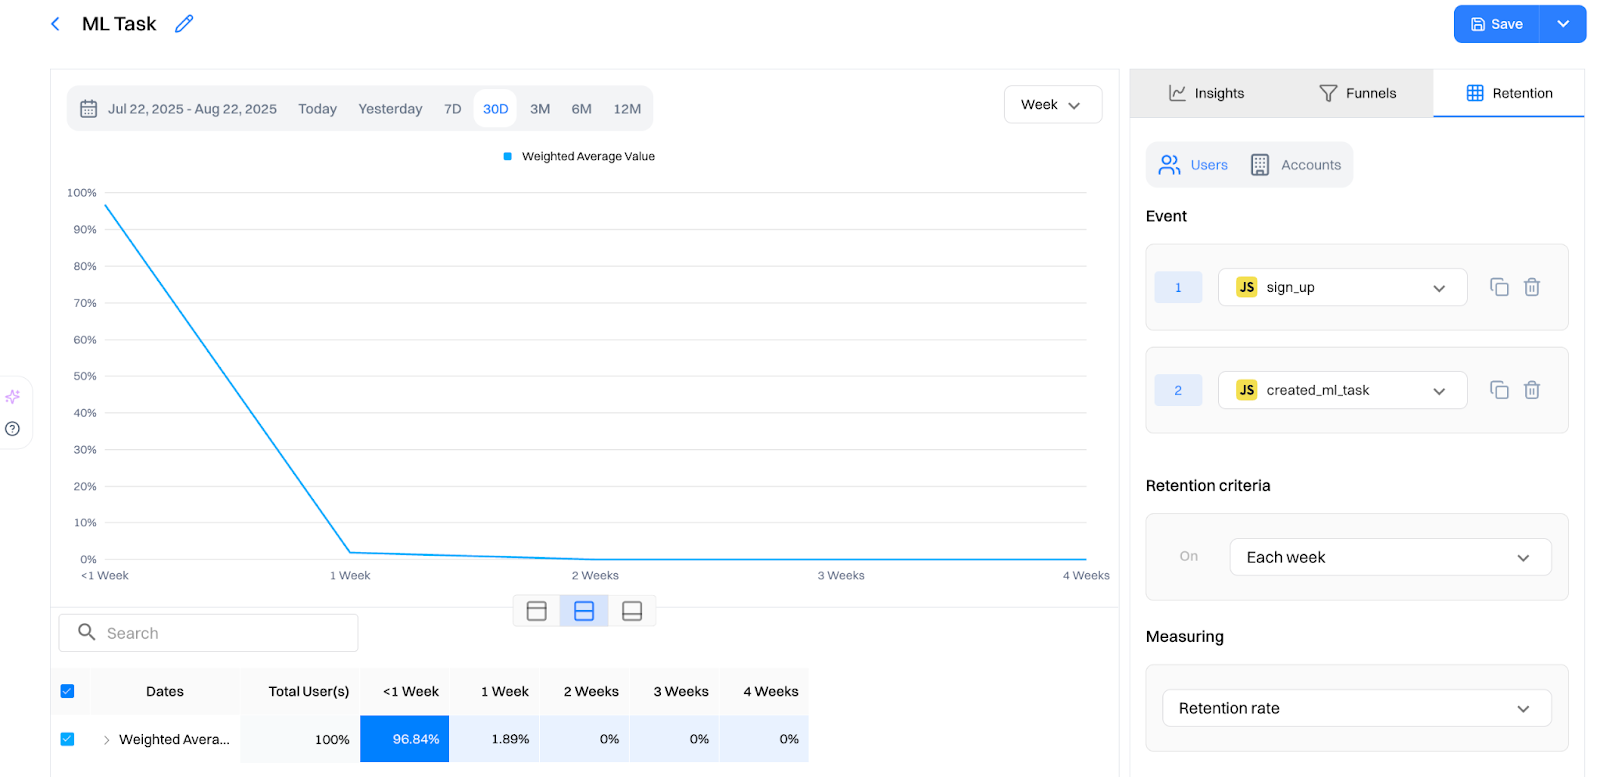
Step 4: Build a Retention report in Analytics
Measure how often people return. See which features correlate with coming back and which segments fall off.
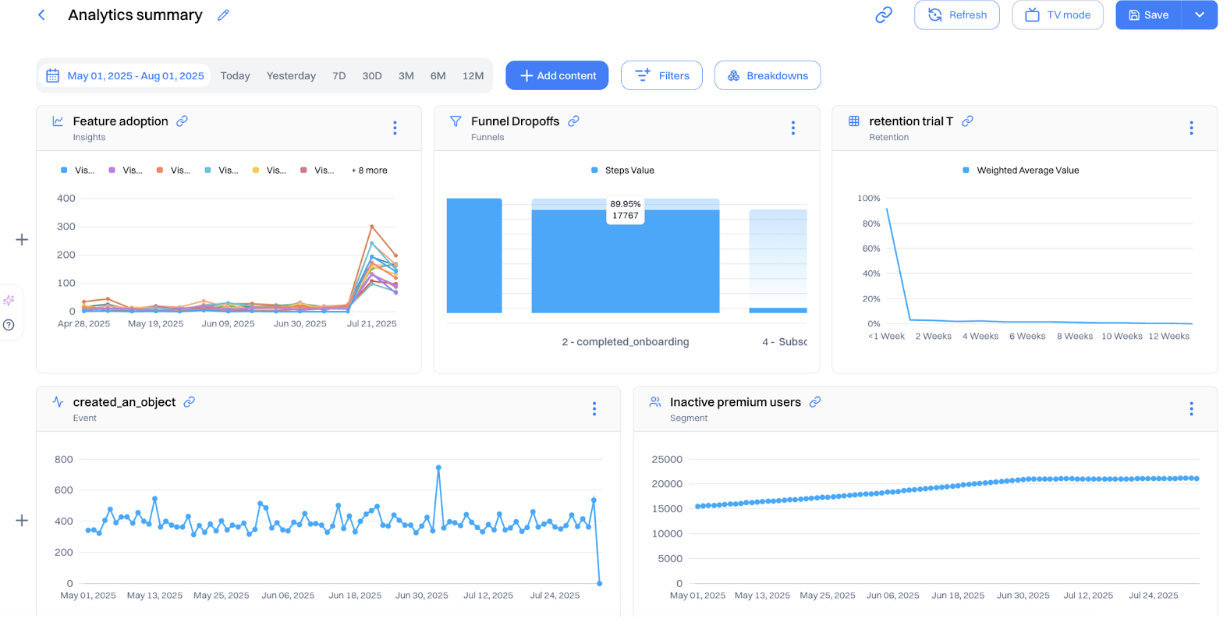
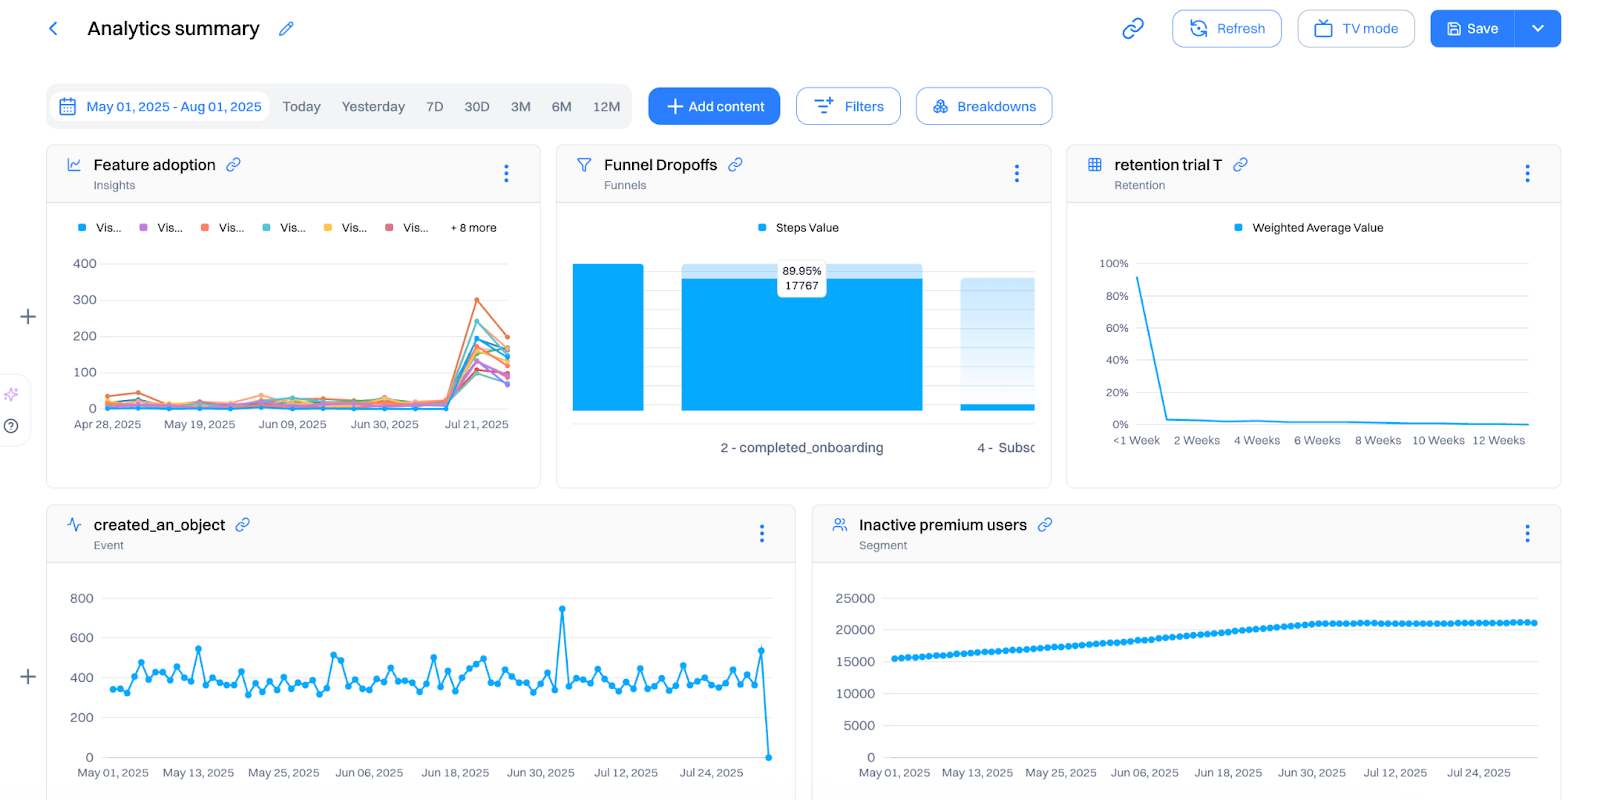
Step 5: Assemble a Dashboard
Pin the Insight, Funnel, and Retention reports. Add any Event, Segment, or Journey analytics you need. This becomes your weekly control room.
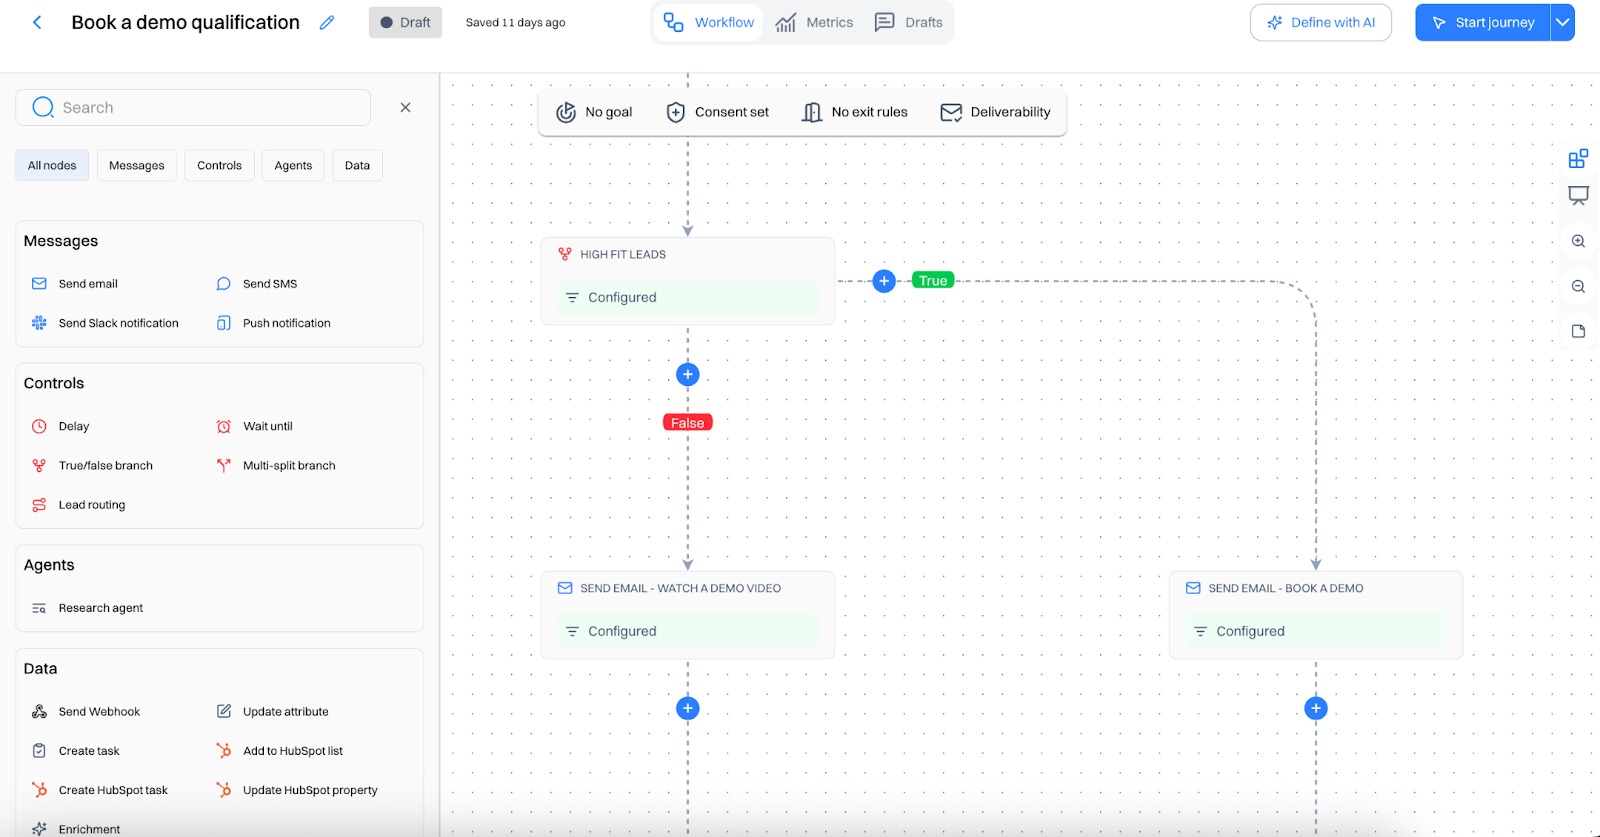
Step 6: Act and measure
See a dip at a step? Launch a small Journey or tweak an on-site Experience. Watch the same reports for lift. Keep what works, roll back what doesn’t.
Good to Know
- Keep event names simple and consistent; you don’t need many, just the right ones.
- Mark Goal Events (success) and Intent Events (early signals) so reports and targeting stay aligned.
- Prefer recent windows over permanent flags; freshness beats static lists.
- Start small: one feature, one funnel, one cohort, then expand when you see signal.
FAQs
How is Intempt different from traditional CRMs?
Unlike traditional CRMs that rely on manual data entry and static records, Intempt uses AI agents to research, segment, qualify, and enrich leads continuously, keeping your pipeline moving without constant human intervention.
What is the built-in Customer Data Platform (CDP) and why does it matter?
The built-in CDP unifies all your customer data across channels into a single profile. It resolves user identities by merging anonymous and known sessions, connects users to their companies, and combines behavioral, firmographic, and journey data. This gives your team a complete, real-time view of every customer.
How does AI-powered segmentation work in Intempt?
You can create customer segments simply by describing them in plain language. The AI analyzes lifecycle, qualification, and engagement data to build segments automatically. These segments update in real time as new data comes in, so your campaigns always target the right audience.
What data enrichment sources does Intempt use?
Intempt pulls live enrichment data from external sources, including People Data Labs, DropContact, and other public databases. This fills in missing attributes on user and account records automatically, keeping your data complete and current.
Is Intempt compliant with GDPR and CCPA?
Yes. Intempt includes built-in consent management tools for GDPR and CCPA compliance. You can collect and track user permissions, handle right-to-be-forgotten and data portability requests with one click, and offer customers a customizable preference center.
What platforms does Intempt integrate with?
Intempt offers native integrations with popular platforms, including HubSpot, Shopify, Stripe, and more. It provides real-time data sync across your CRM, marketing, and eCommerce tools, with customizable triggers, field mappings, and data flows to fit your specific workflows.
Check out Growth Play Library ➡️
Get started free on GrowthOS ➡️
Book a growth call ➡️
Join The Full Stack Marketer 📈
Zero theory or mindset discussions here; just actionable marketing tactics that will grow revenue today.

Web A/B testing
Use front-end A/B and multi-page experimentation product built for any business size. Run multiple experiments on the same page.

Targeting & personalization
Deliver targeted messaging, personalized offers and recommend the most relevant content for your users.

Visual editor
Empower your team to collaborate with an easy-to-use visual editor without using developer time to get things up and running.

Analytics
Gain insight into the impact of your experiments with statistically valid results. No complex statistical analysis required.

Server & client-side testing
Go beyond client-side testing and deploy experiments on the server-side. Test and optimize content changes and even complete re-brands.

Flexible goal selection
Select the right goal for each personalization and experimentation campaign to ensure you’re optimizing towards the right objectives.
.svg)
Sid Chaudhary
Founder & CEO


Connectors
Product
Looking for ways to 📊 grow faster?
Discover marketing workspace where you turn audiences into revenue.
Learn about Intempt🔐 Steal these Growth Plays


Subscribe to AI Marketer 🔮
Get our newest weekly use cases and resources for
Marketing & Sales teams
Web A/B testing
Use front-end A/B and multi-page experimentation product built for any business size. Run multiple experiments on the same page.
Targeting & personalization
Deliver targeted messaging, personalized offers and recommend the most relevant content for your users.
Visual editor
Empower your team to collaborate with an easy-to-use visual editor without using developer time to get things up and running.
Analytics
Gain insight into the impact of your experiments with statistically valid results. No complex statistical analysis required.
Server & client-side testing
Go beyond client-side testing and deploy experiments on the server-side. Test and optimize content changes and even complete re-brands.
Flexible goal selection
Select the right goal for each personalization and experimentation campaign to ensure you’re optimizing towards the right objectives.
.svg)


.svg)
.svg)
.webp)
.webp)