

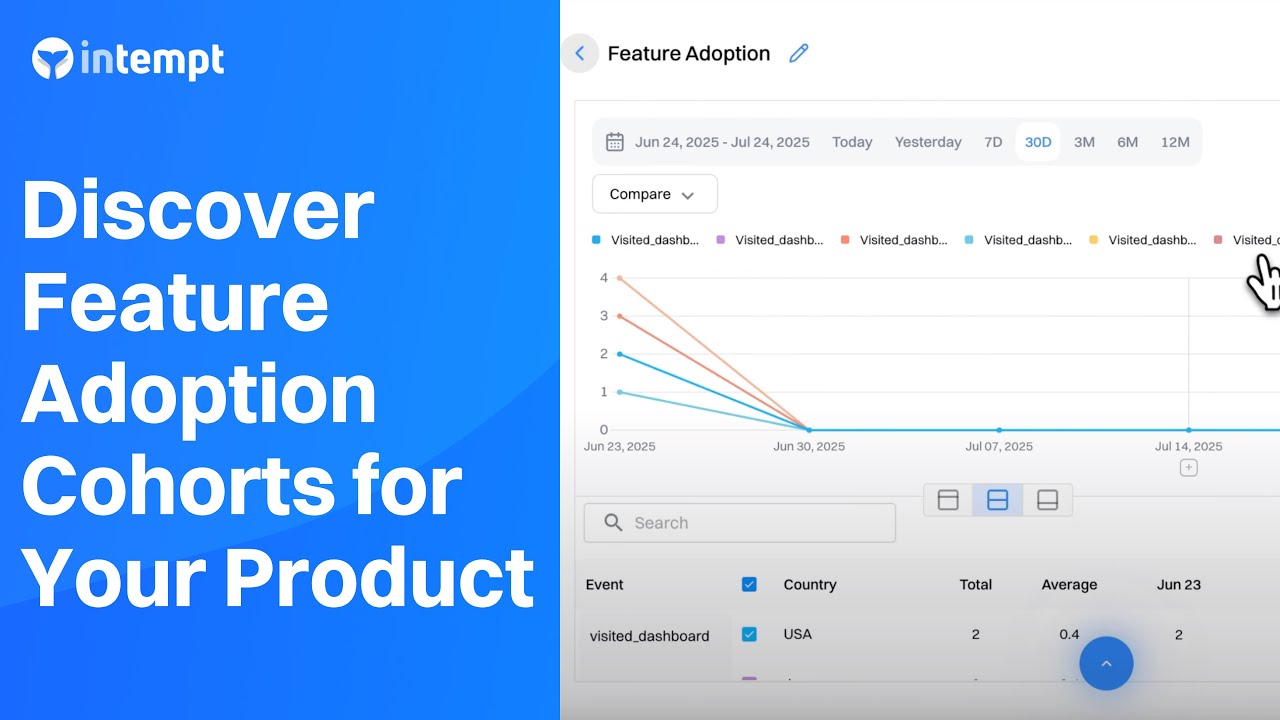
Analyze which product features drive activation and long-term value, then use that insight to personalize onboarding and retention.
About the Growth Play
In SaaS, product usage is never uniform. Some users adopt critical features quickly. Others get stuck or never activate key functionality.
This Growbook shows you how to uncover the features your best users adopt and how to use that knowledge to build smarter onboarding, trigger personalized nudges, and inform better product roadmap decisions.
We'll use Otto, a demo project management SaaS platform, as our example.
TL;DR
Track and define core feature usage events ('created ml task', 'invite team members, 'created an object' and 'visited dashboard')
Build Insights reports to measure adoption across cohorts
Break down behavior by 'subscription', 'company size', or 'region' to spot trends
Create real-time segments like "Dashboard Adopters" or "Inactive Users"
Launch onboarding journeys tailored to feature usage (or lack of it)
Benefits
Map adoption by cohort: See which features are used by your most engaged and valuable users.
Spot activation bottlenecks: Identify features that are not activated by users that stall or churn.
Personalize onboarding: Trigger nudges based on what users have or haven't tried.
Align teams around real usage: Give product, marketing, and success a shared view of what users actually do - so everyone works from the same source of truth.
How It Works
Step 1: Set up tracking for user activity
Install Intempt's JavaScript SDK:
Integrate Intempt's JavaScript SDK into your product to begin capturing behavioral events.
Follow the JavaScript SDK integration guide to ensure proper setup.
Step 2: Define the events you want to track
In Intempt, go to Events and verify that the following key feature events are being tracked: 'created ml task', 'invite team members', 'created an object' and 'visited dashboard'.
These represent meaningful actions across different levels of product adoption.
You can also define new events if needed like 'scheduled sprint', 'joined workspace' and 'exported report'.
Step 3: Build your Insights report
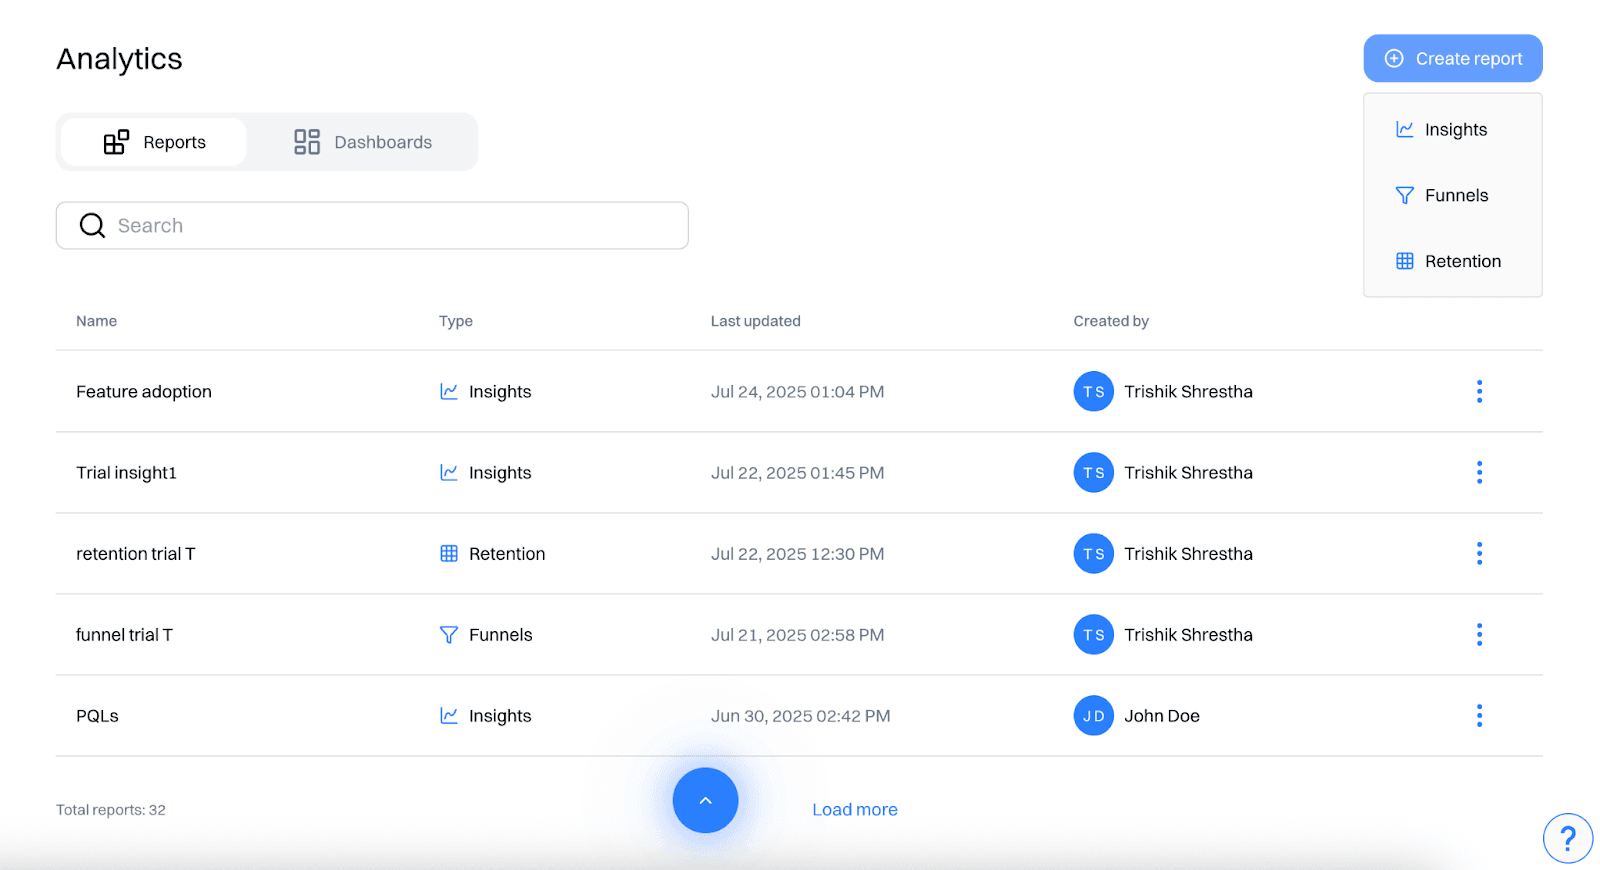
Navigate to Analytics- 'Insights' and create a new report.
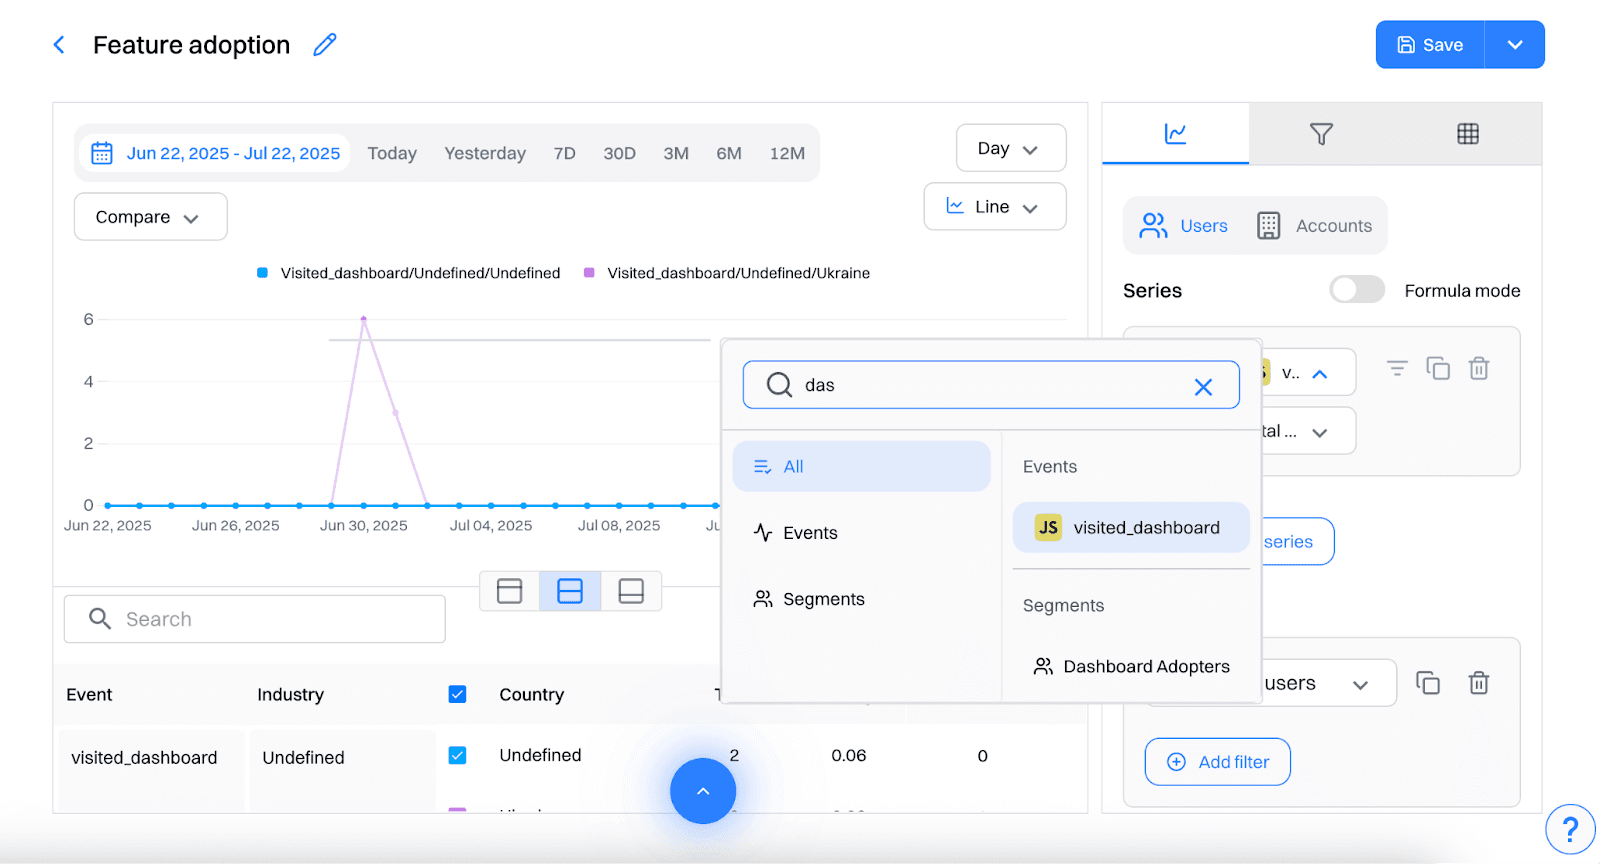
Choose a feature usage event to analyze for example, 'visited dashboard'.
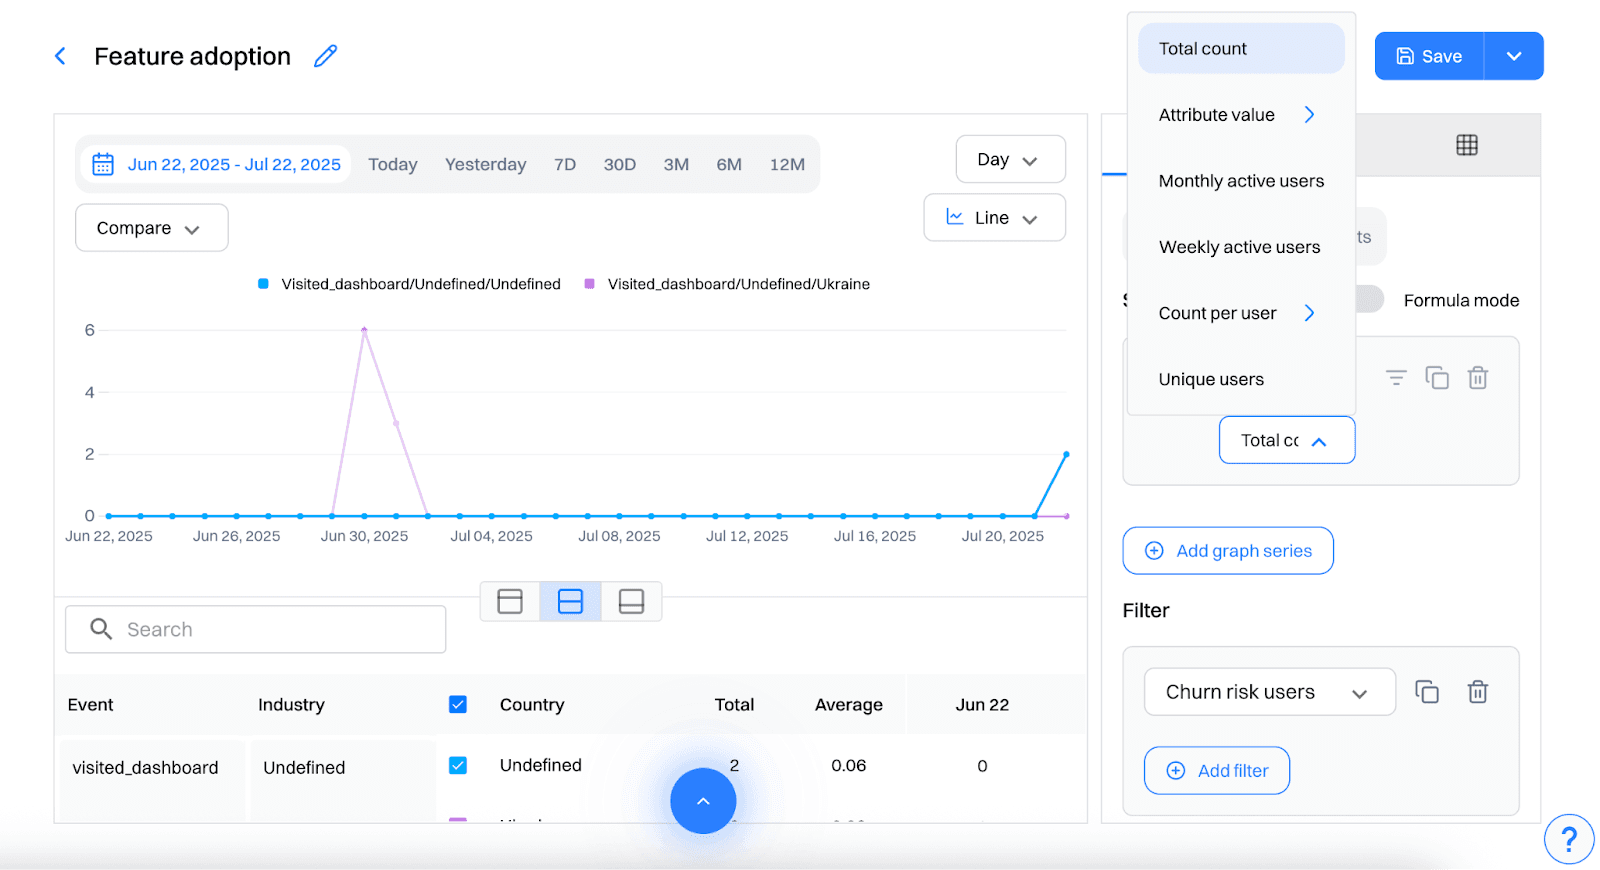
Select a metric such as:
- Count of users who triggered the event
- Average frequency per user
- % of active users performing the action
Step 4: Break down usage by user attributes
Use the 'breakdown' field to compare behavior across:
- Plan tier (e.g., Free vs Pro)
- Company size
- Industry
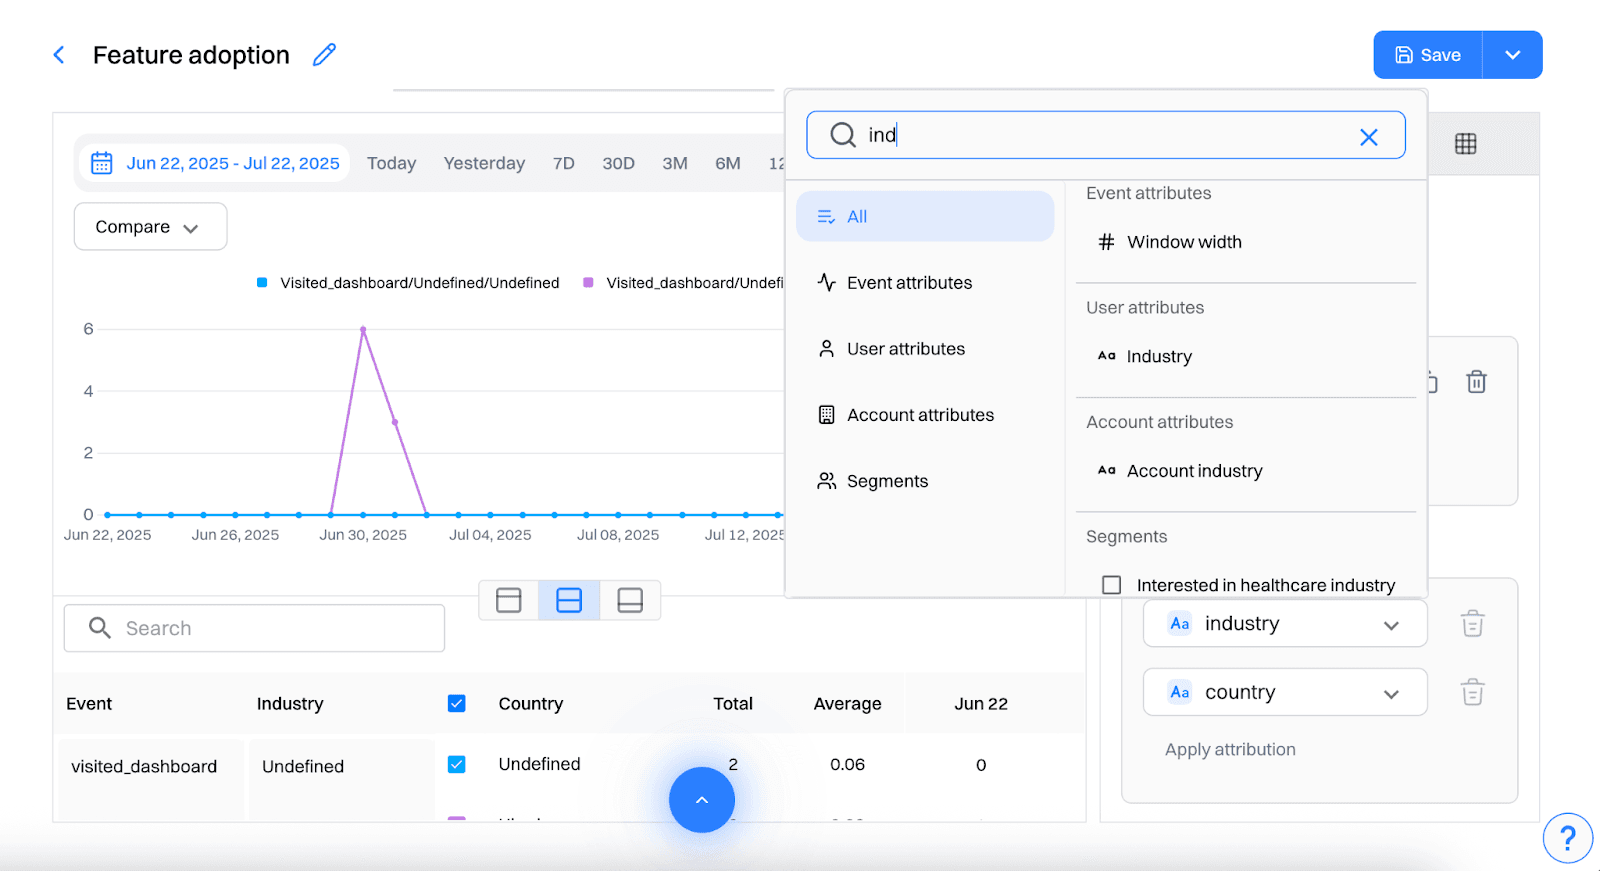
Apply filters to narrow your scope:
- Date range (e.g., last 30 days)
- Region (e.g., North America)
- Account type (e.g., trial vs paid)
Spot behavior patterns
You might notice:
Dashboard usage is 5x higher among Premium plan users.
Smaller teams rely heavily on 'invite team members', while larger teams don't.
Healthcare companies engage early with ML task creation.
These behavioral patterns help you identify cohorts not based on who they are, but what they actually do.
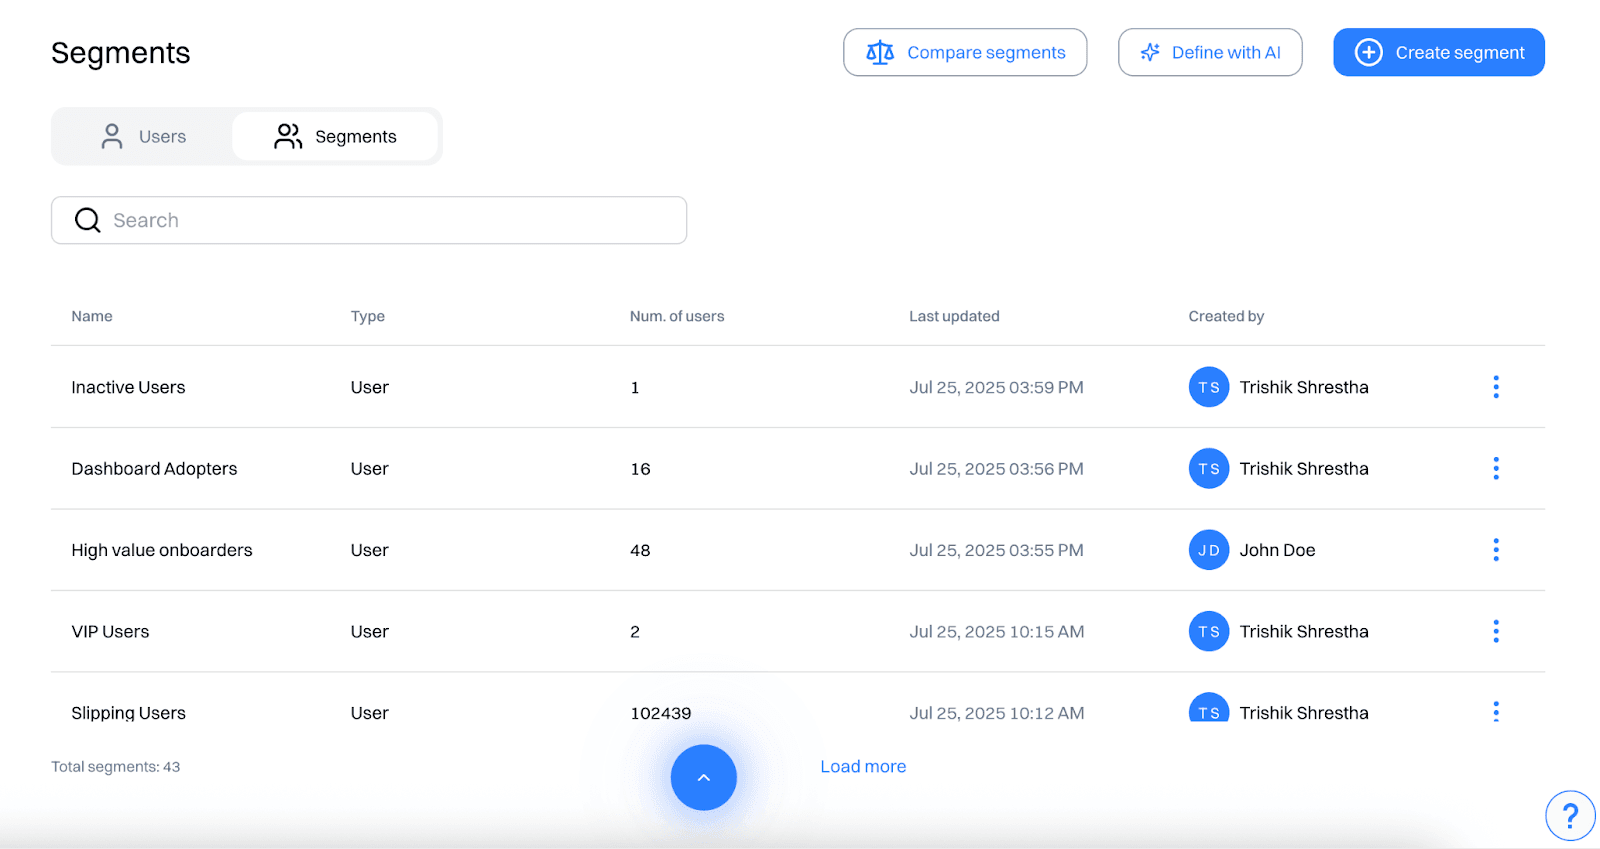
Step 5: Turn insights into segments
Based on what you discover, create real-time segments like:
- "Dashboard Adopters": users who visited the dashboard 3+ times in the first 7 days
- "High Value Onboarders": users who triggered 3+ product features in week one
- "Inactive Users": users who signed up but didn't trigger 'exported report'
Step 6: Trigger targeted journeys
Use these segments to trigger targeted journeys:
- Encourage "High Value Onboarders" to explore automation features
- Re-engage "Inactive Users" with reminders or walkthroughs
- Offer additional features to "Dashboard Adopters" for more activation
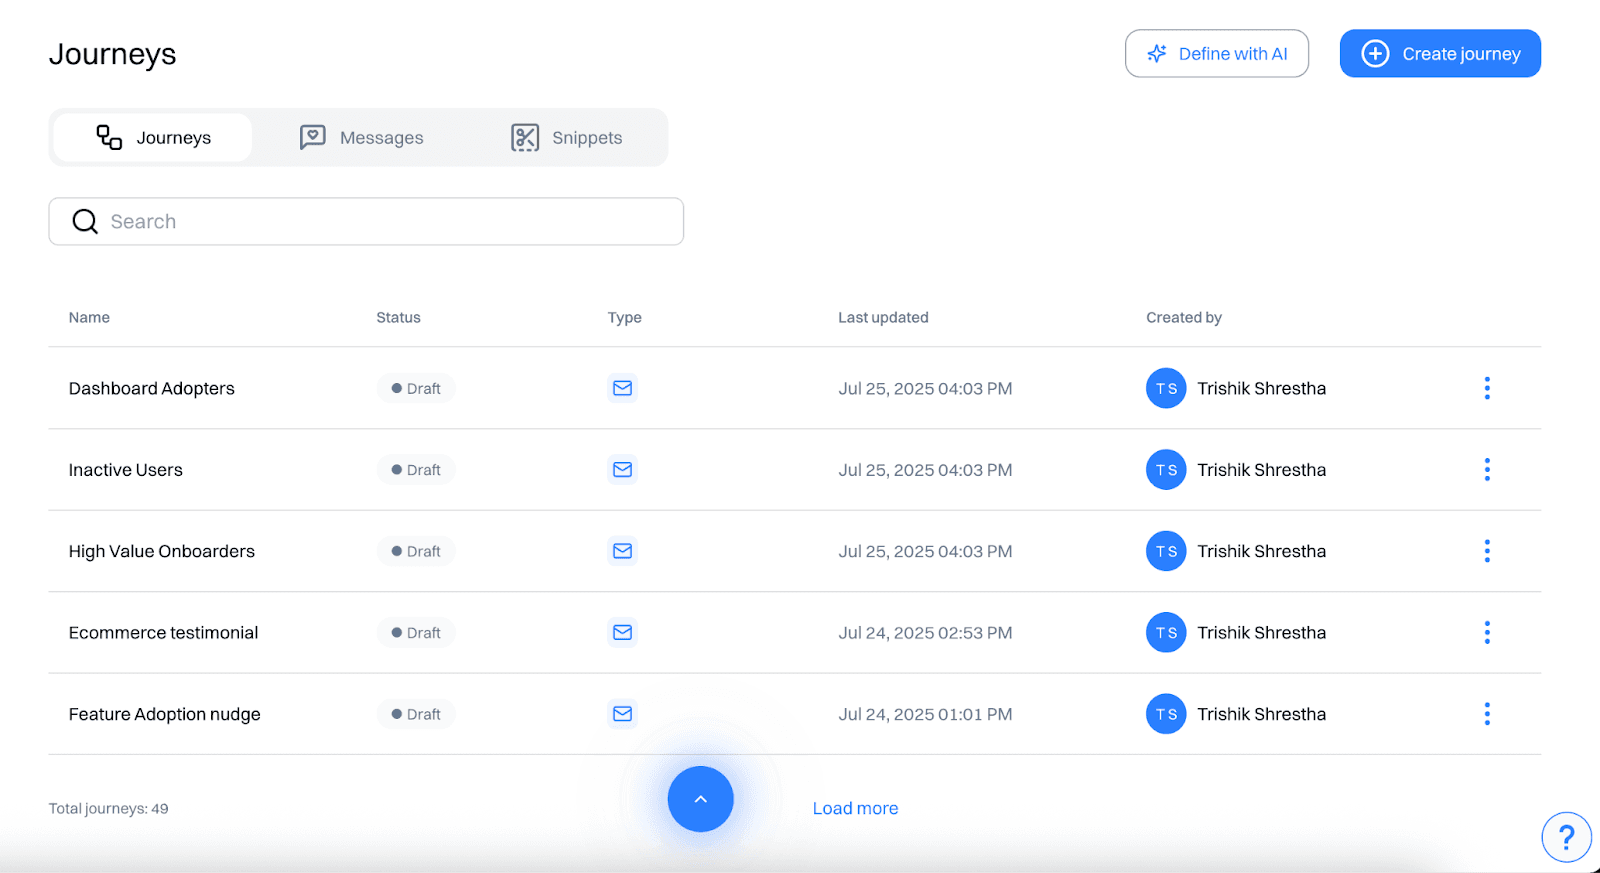
Note: for detailed walkthrough about creating a Journey, check out the Growbook on Personalized Category Upsell
Step 7: Measure and optimize
Continue tracking feature usage over time using updated Insights Reports.
Compare adoption before and after journeys are launched.
Identify which cohorts respond best and evolve your strategy based on what actually works.
Frequently asked questions. Answered.
Track the core actions that represent meaningful engagement in your product. For a project management tool, that might be creating tasks, inviting team members, visiting the dashboard, or exporting reports. You can also define custom events like "scheduled sprint" or "joined workspace" if those matter for your product.