

 0.0on G2
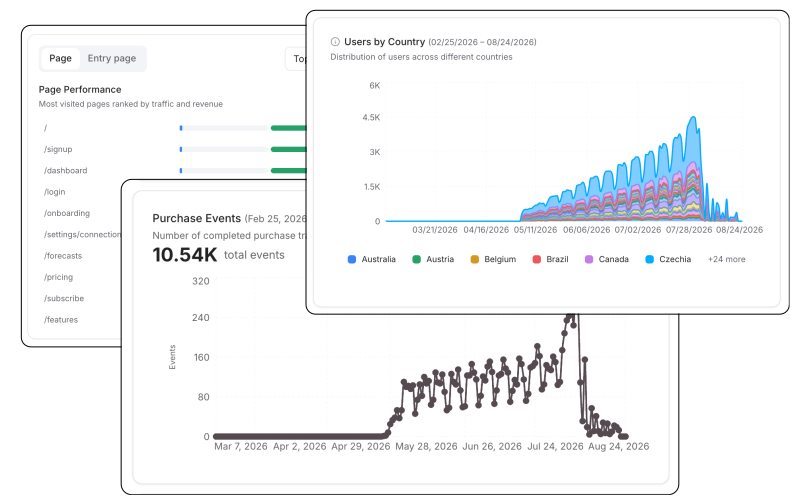
OOTB dashboards, ready from day one.
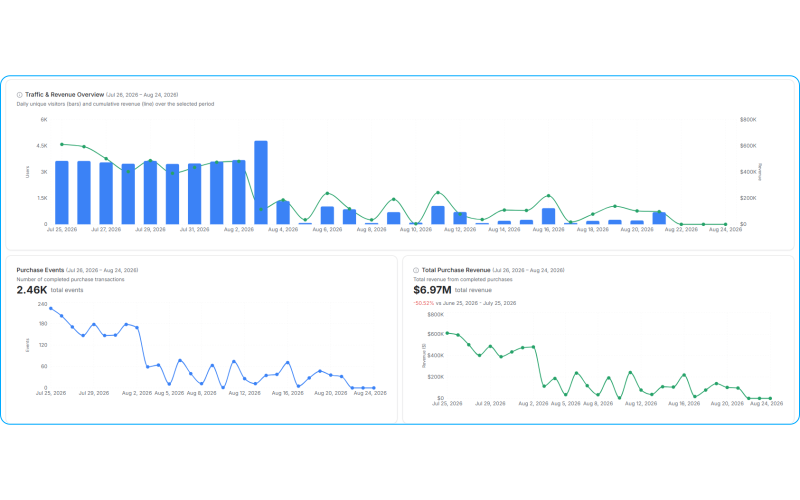
Intempt ships pre-built analytics dashboards: Acquisition, Activation, Revenue, and Retention, with your real data loaded on arrival.
- Live on day oneTraffic, revenue and engagement dashboards exist before you configure anything.
- Period comparison by defaultEvery chart carries the previous period alongside the current one.
- The Data Analyst agent flags what changed"Sign-ups dropped 18% since Tuesday. Here is why."
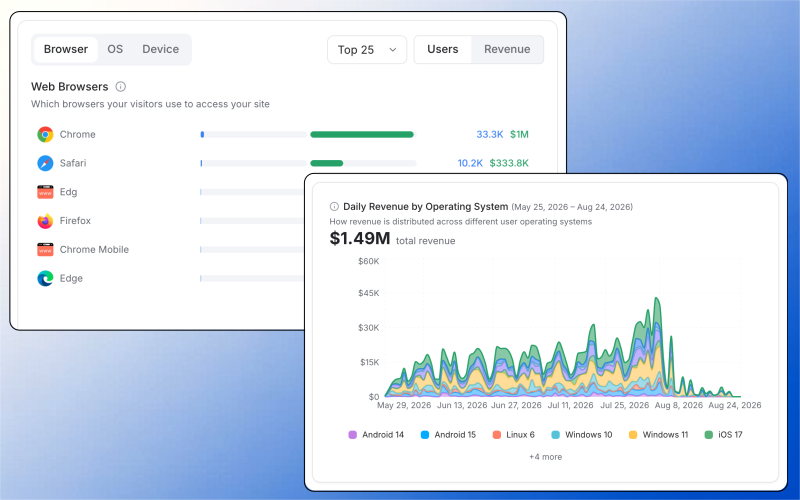
Every metric links to the users behind it.
Click any bar, any trend, or any count and land directly on the list of users who drove that result. The Data Analyst agent reads the pattern and recommends what to do next.
- Metrics link to the peopleClick a number and get the users it counted.
- No report queueThe answer is on the dashboard rather than in someone's backlog.
- The Data Analyst agent recommends"412 users have not logged in since your last release. Reach out now."
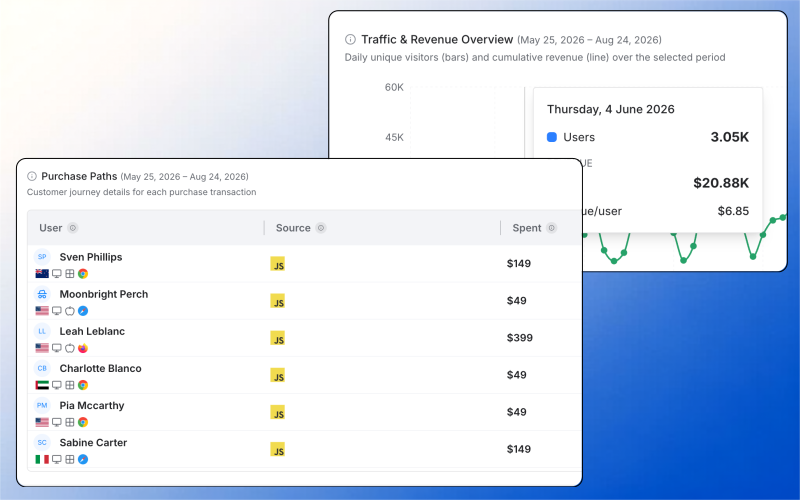
One live view that your whole team reads.
When every team member reads the same live dashboard, decisions happen faster and the debate about which number is right stops.
- Shared and liveEvery viewer sees the same numbers at the same moment.
- Role-based permissionsWho sees which dashboard is set by role, not by who has the link.
- The Data Analyst writes it"Here is what moved this week and why."
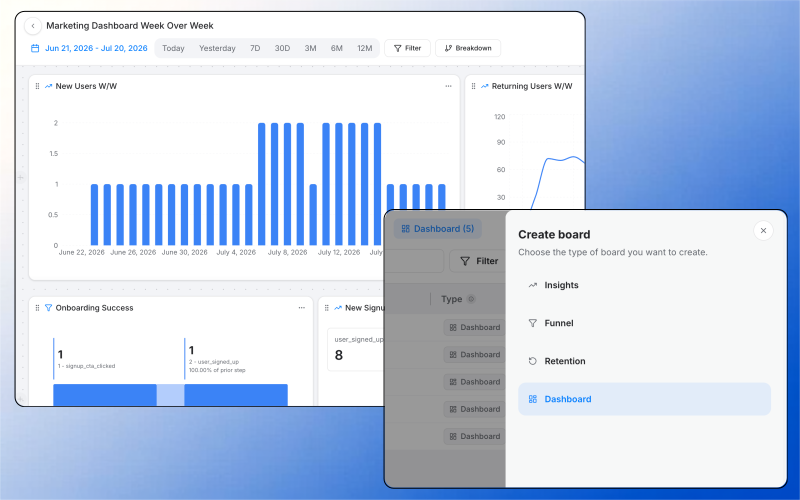
Built for the outcomes that matter.
Three analytics use cases teams run on Intempt.
Wired into the toolsyour team already opens.
Slack, Stripe, Twilio, SendGrid, Gmail, Google Calendar, Firebase, Apache Kafka, AWS. Blu Agent operates them for you without a browser tab.
See every integration


Teams love it
They stopped stitching tools andhired one system.

 StockInvest

“Acquisition and retention finally feel like one connected motion instead of two separate problems.”
Jim Stromberg
CEO, StockInvest

 FieldsUSA
“We finally have one system that sees the whole customer journey.”
Eric Gardner
COO, FieldsUSA

 Hoperfy
“With Intempt, we built a signal-led pipeline driven by real behaviors.”
Tadas Kertenis
Co-founder, Hoperfy
Frequently askedquestions.
Everything you need to know about Intempt analytics dashboards.