- Generative AI removes the mechanical work in front of every analytics decision. Natural-language SQL, automated anomaly detection, and AI-generated dashboard summaries replace rote translation and scanning.
- McKinsey found 78 percent of organizations now use AI in at least one function and 71 percent deploy generative AI regularly. Adoption has crossed the demo threshold into production expectation.
- Use it to draft the query and scan the funnel. Keep the judgment call on what the number means with the analyst.
Generative AI data analytics starts with a routine most teams still run by hand: every Monday, someone on your team opens last week's dashboard, scans it for anything that moved, and writes a summary paragraph for the exec channel. Every time someone in sales or product asks "can you pull the numbers on X," an analyst translates that English question into a query by hand. Neither of those steps requires human judgment anymore. They require human time, and generative AI is now good enough to take both off your plate.
Generative AI in analytics isn't about replacing the analyst's judgment call. It's about removing the mechanical translation and scanning work that sits in front of every real decision, so the time an analyst actually spends goes toward deciding what a number means instead of producing the number in the first place. The rest of the post covers what the category actually is, why the adoption threshold matters now, the four concrete patterns in production today, a worked example of each, the three failure modes to plan for, and where to route the mechanical work first.
| Metric | Value |
|---|---|
| Orgs using AI in at least one function (McKinsey 2025) | 78% |
| Orgs deploying generative AI regularly in a business function | 71% |
| Mastercard AI fraud detection vs. static rule-based systems | ~2x detection speed, fewer false positives |
What is generative AI for data analytics?
It's generative models applied directly to analytics work: translating a plain-English question into a query, scanning a metric for a deviation from its normal range without a human-written threshold rule, and generating a narrative summary of what a dashboard or funnel actually shows. The output isn't a chatbot answer about your data. It's the query, the anomaly flag, or the summary itself, produced without someone manually writing it.
How it differs from traditional BI plus a chatbot
The prior generation of "AI in BI" was a chat interface bolted onto a static dashboard. You could ask "what did last week look like?" and the tool would read the dashboard back to you. Generative AI for analytics goes one layer deeper: the model produces the query, walks the schema, decides the aggregation, and generates the artifact. The chatbot layer reads pre-built dashboards; the generative layer builds them.

Why now
Four shifts converged in the same year to move this from roadmap to baseline. None of them is a single vendor's product. All of them show up in every mature analytics stack in 2026.
- Adoption crossed a real threshold, not a hype threshold. McKinsey's 2025 Global Survey found 78% of organizations already use AI in at least one business function, with 71% deploying generative AI regularly. Analytics work is one of the functions this shows up in most, not an edge case.
- Natural-language-to-SQL stopped being a showcase feature. Across the analytics tooling space in 2026, plain-English querying is treated as a baseline expectation, the same way autocomplete became a baseline expectation in code editors a few years earlier.
- Automated anomaly detection has real production precedent, not just theory. Mastercard's fraud-detection systems are a widely cited example of AI flagging anomalous patterns automatically, at a scale no static rule set could keep up with. The same underlying pattern, watching a metric's normal range and flagging deviations, applies to conversion rate, signup velocity, or checkout completion just as well as it applies to fraud.
- Analytics is moving out of standalone BI tools and into the platforms teams already work in. Instead of exporting data to a separate reporting tool, the querying, anomaly detection, and summarization increasingly live inside the CRM, the CDP, or the operational platform generating the data in the first place, which is the same consolidation argument behind revenue attribution without stitching three tools.
What this looks like in practice
This isn't a single feature. It shows up as several distinct capabilities, usually adopted separately before a team realizes they're the same underlying shift.
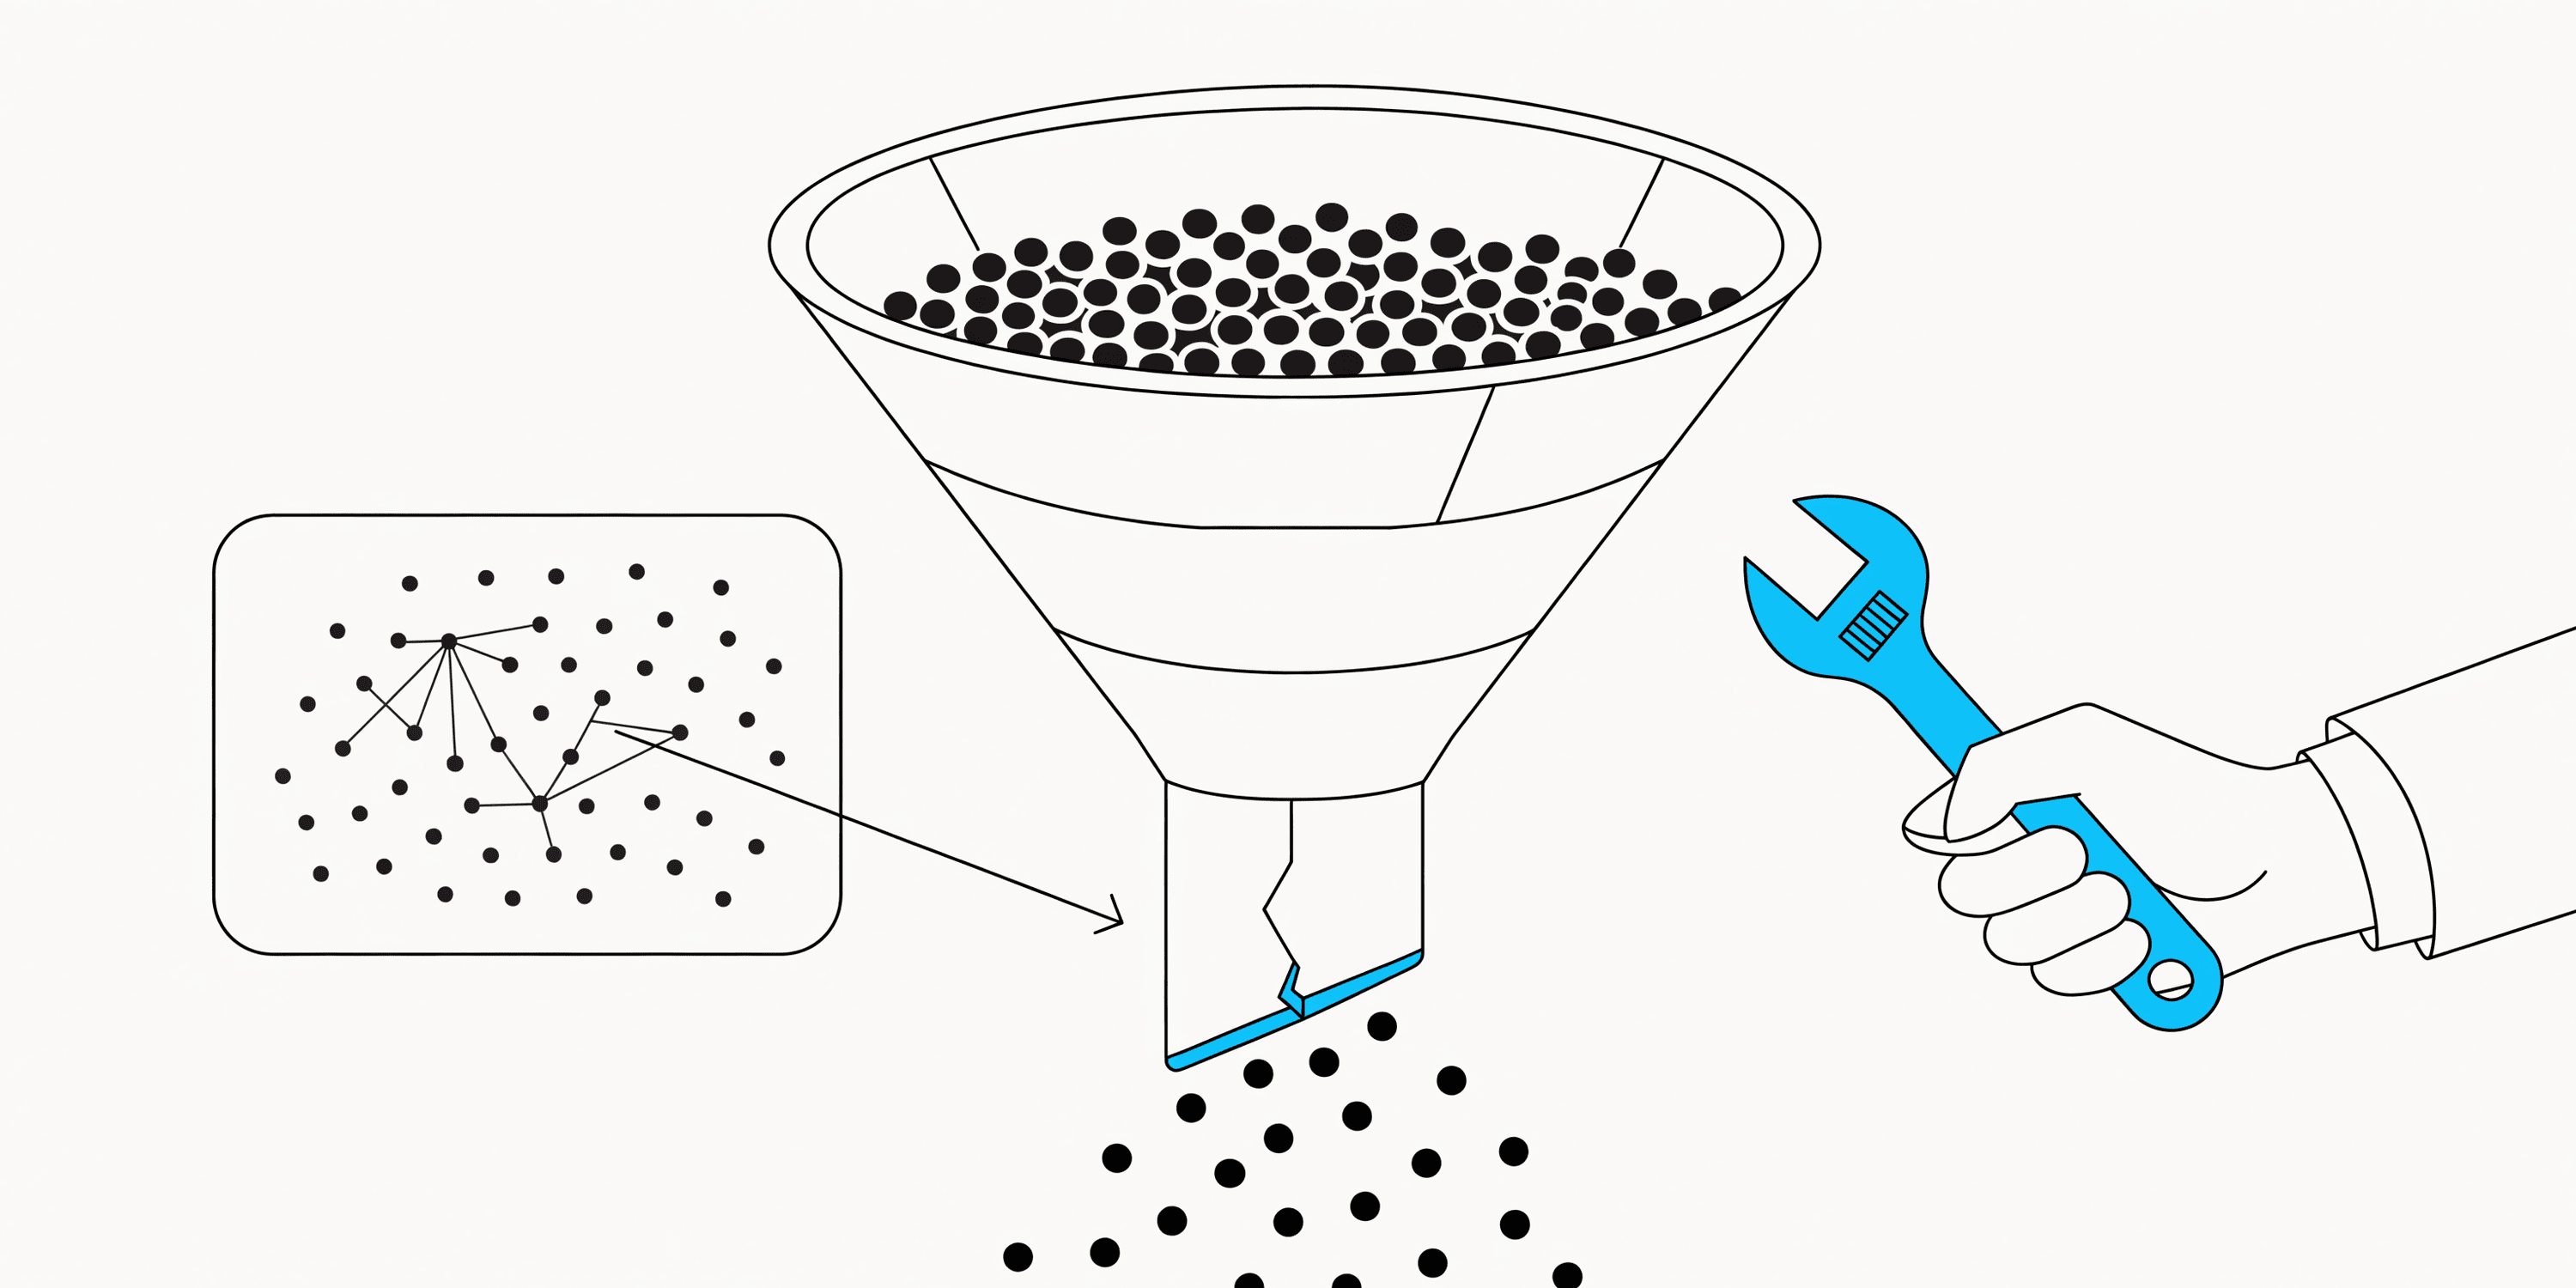
- Natural-language query interfaces: someone types "show me signup-to-activation conversion by channel for last month" and gets a real funnel back, without writing SQL or waiting on an analyst's queue.
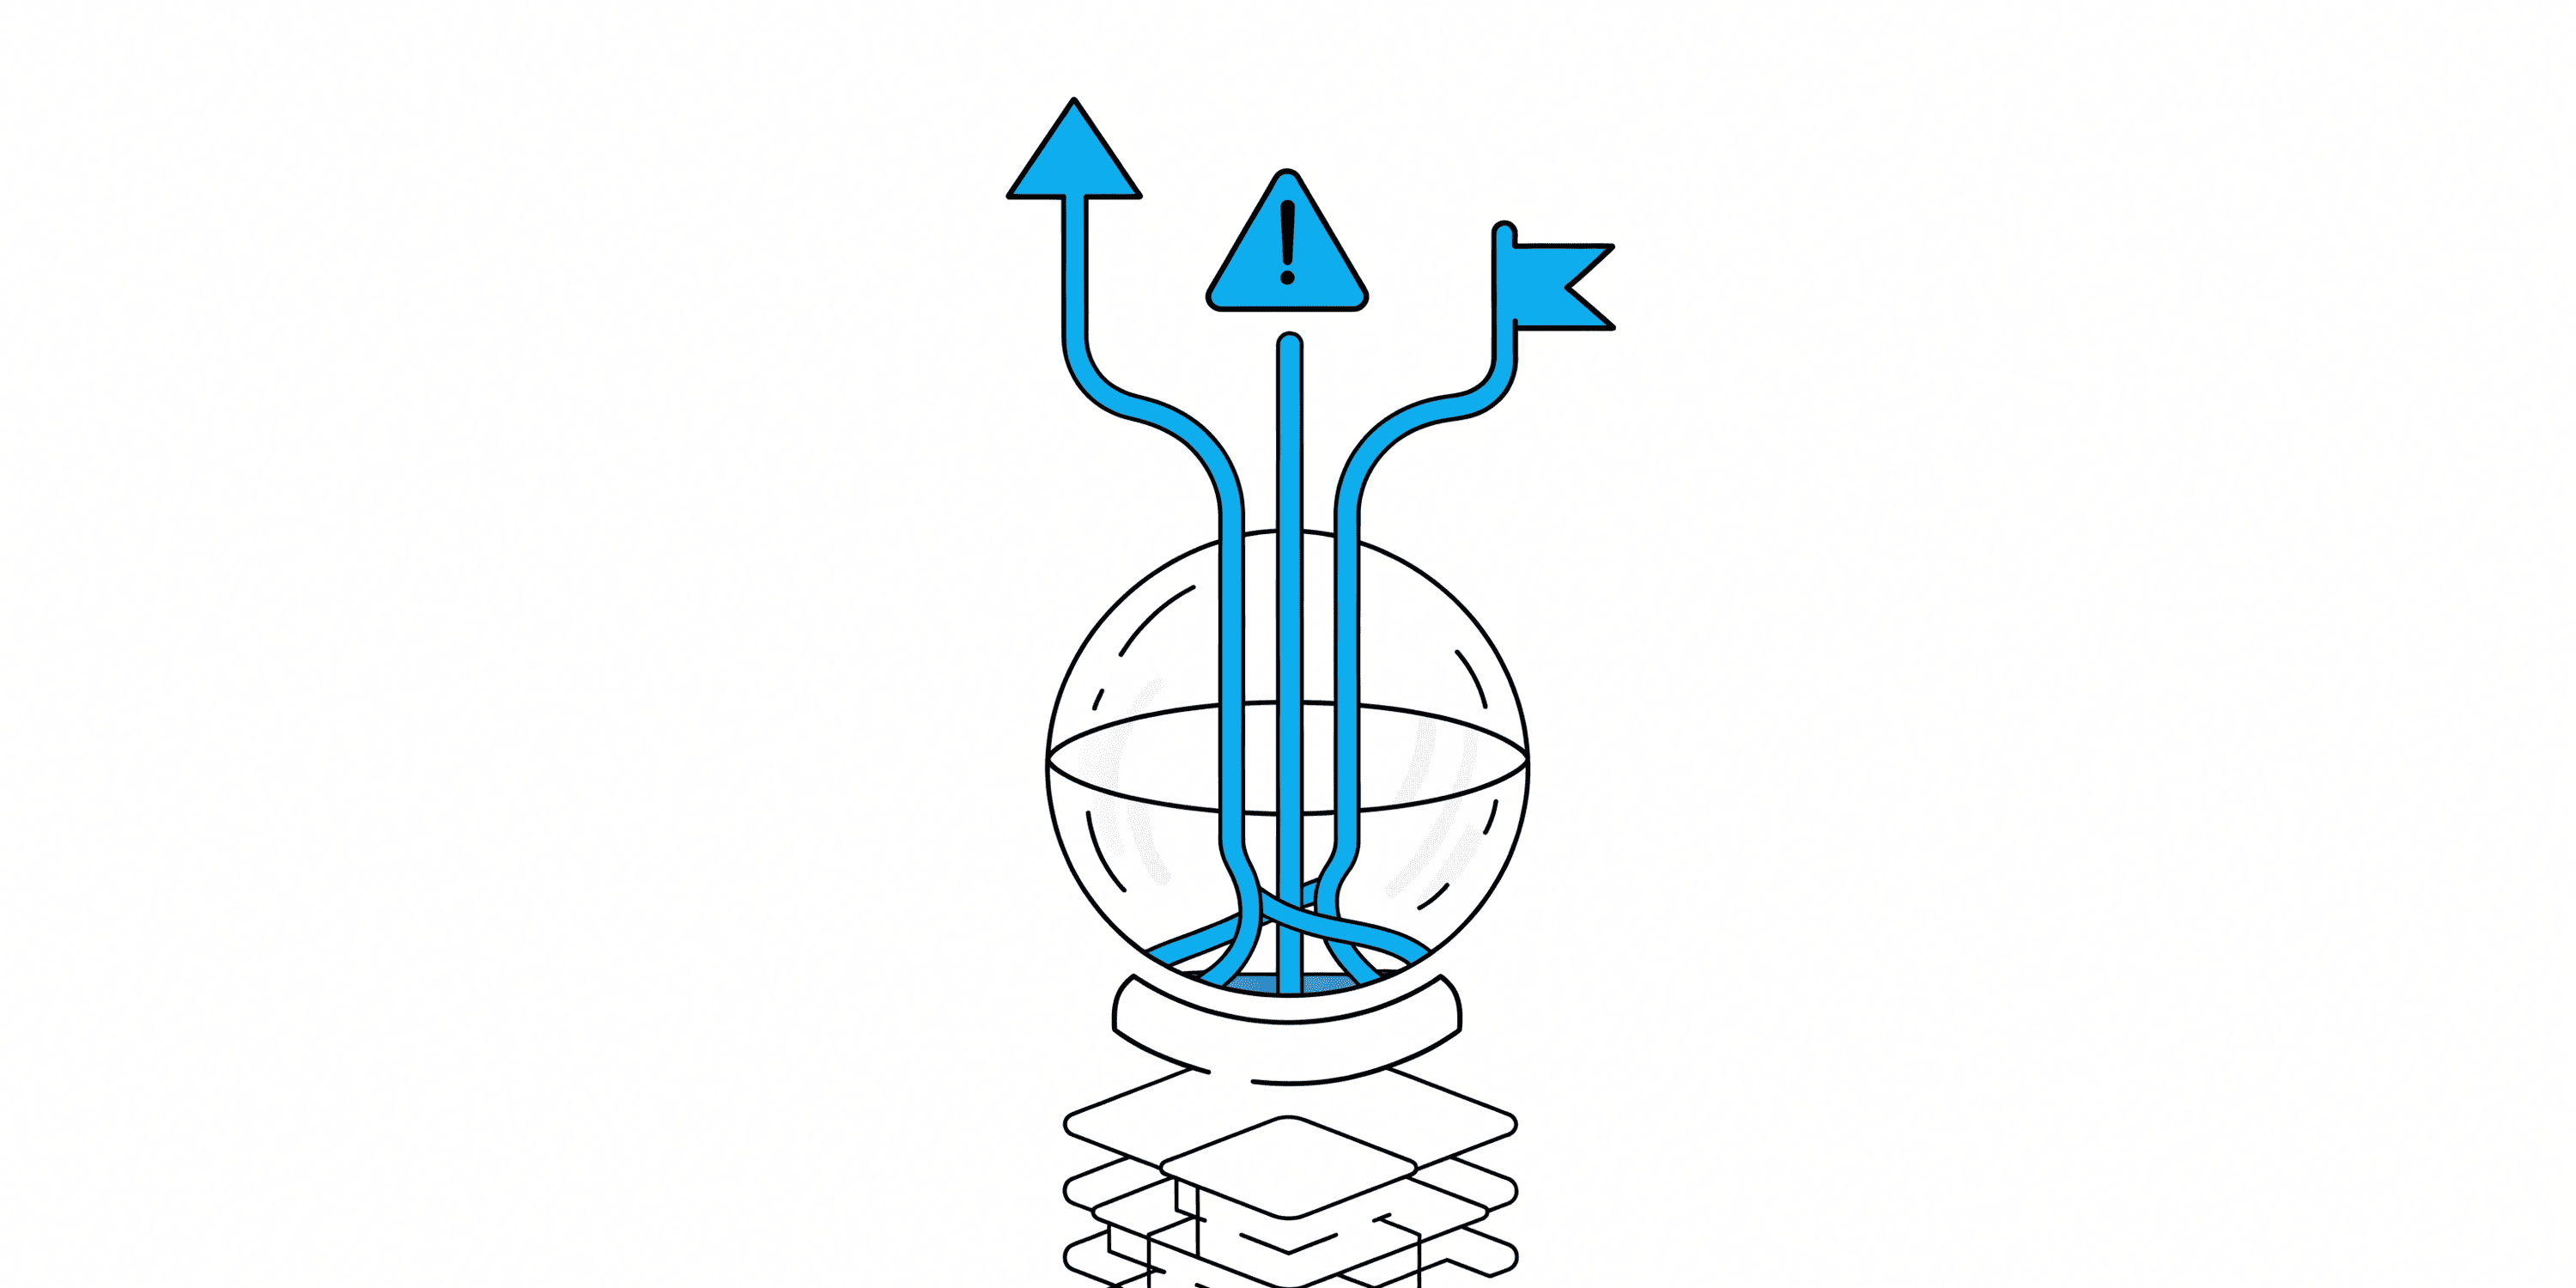
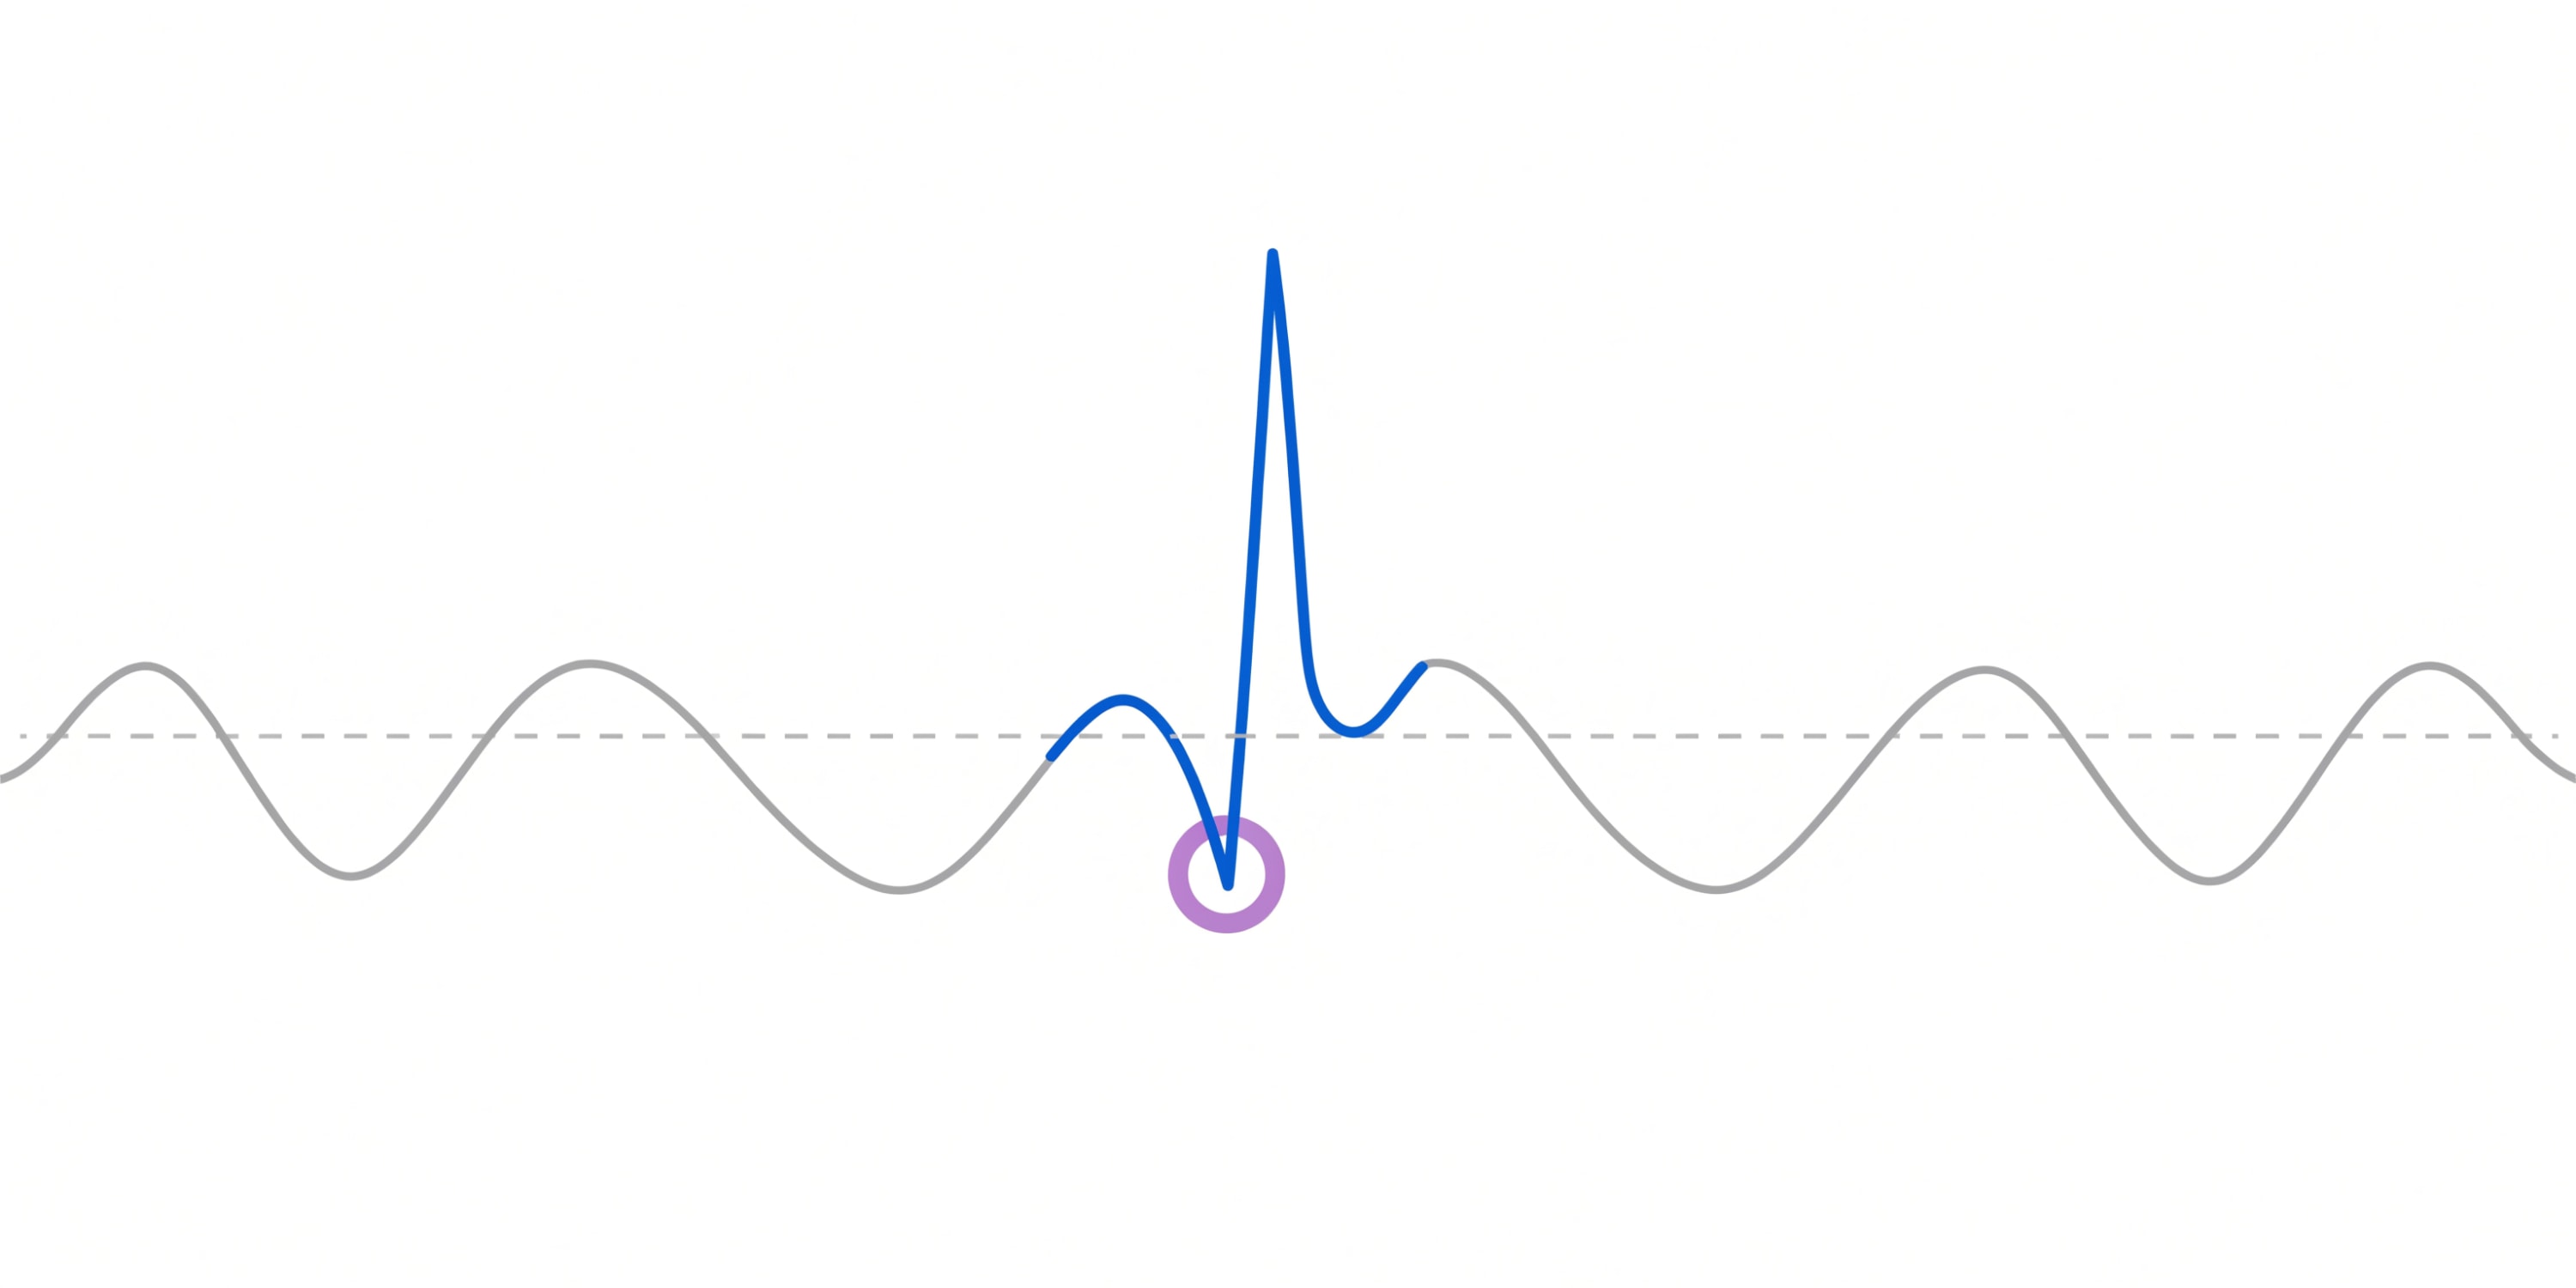
- Automated anomaly detection: a metric moves outside its normal range and the system flags it directly, instead of waiting for someone to notice during a weekly review.
- AI-generated narrative summaries: instead of a person writing "MRR grew 4%, mostly driven by expansion revenue in the enterprise segment" by hand every week, the summary is generated directly from the underlying dashboard data.
- Synthetic data generation for testing: teams generate realistic-but-fake data to test a new dashboard or model before real production data exists.
- Analytics embedded in the platform generating the data, not a separate BI layer: funnels, retention, and dashboards built natively where the events already live, rather than exported to a third-party reporting tool.
Four patterns, four worked examples
| Pattern | The mechanical job it replaces | Example prompt or input |
|---|---|---|
| Natural-language query | Analyst writes the SQL from a chat message | "Show signup-to-activation by channel, last 30 days, segmented by plan" |
| Automated anomaly detection | Analyst re-checks the dashboard for anything moving outside normal | Live event stream on checkout completion rate |
| Narrative summary | PM writes the weekly exec paragraph by hand | MRR + retention + churn numbers from the dashboard |
| Synthetic data for testing | Engineer copies a production slice and scrubs PII | A schema and a distribution shape |
Where the analyst's job actually shifts
The reframe worth naming: the analyst's job stops being production and starts being adjudication. Not "pull the numbers," but "is this number right, does this anomaly matter, does this summary read correctly to the exec." The mechanical layer produces the artifact; the analyst decides whether it should ship.
| Old analyst hour spent on | New analyst hour spent on |
|---|---|
| Writing SQL from a Slack question | Checking a generated query's join logic before it hits production data |
| Manually scanning last week's dashboard | Adjudicating anomaly flags - which are real, which are noise |
| Writing the weekly narrative summary | Editing the generated summary for tone and executive context |
| Building the same funnel for the tenth time | Designing the shared metric definition that the funnel builder reuses |
The teams moving fastest aren't the ones with the most AI licenses. They're the ones where the analyst has explicitly renegotiated their scope to move up-stack, and where the mechanical work has been formally routed to the AI layer instead of quietly duplicated by a junior hire.
The three failure modes to plan for
The category is real and the tools are shipping, but every deployment has the same three predictable failure modes. Naming them up front turns each one into a checkbox in the rollout plan instead of an incident write-up in month three.
- Schema drift: a natural-language query engine is only as good as its understanding of the schema. Rename a column, split a table, or introduce a new event type, and the model silently returns wrong answers. Fix: a schema-change review that the AI layer sees before the next query runs.
- Alert fatigue: an anomaly detector tuned to catch everything trains the team to ignore it within two weeks. Fix: threshold tuning per metric, and a maximum-alerts-per-day cap that forces prioritization instead of firehose output.
- Hallucinated narrative summaries: a generated exec paragraph reads correct until an analyst notices the number doesn't match the chart. Fix: require the summary to render inline with the underlying chart, so a mismatch is visible without an audit.
What to do about it
Concrete moves, in the order that produces the fastest visible ROI without setting up a governance debate that stalls the rollout. Start with the pattern where the mechanical work is most visible in your team's calendar, not the one with the most vendor hype.
- Audit where your team still hand-writes the same query pattern repeatedly. That's the first candidate for a natural-language query layer.
- Identify the metrics someone manually re-checks on a schedule (weekly, daily) looking for a problem. Those are anomaly-detection candidates, not judgment calls.
- Don't wait for a perfect governed rollout before starting. The realistic risk isn't the AI being wrong occasionally, it's an analyst continuing to do rote translation work that a model already handles reliably.
- Look at whether your reporting lives in a separate BI tool or inside the platform generating the underlying events. Every export step is a place where the AI layer has to be rebuilt twice.
- Set a review cadence for the first six weeks: an analyst reviews every generated query and summary before it goes out. Drop the cadence to spot-checks once the error rate is measurable and stable.
Intempt's Analyze product builds funnels, retention, and dashboards natively from the same event data your team already tracks, with AI-assisted querying and summaries as part of the platform, not a bolted-on reporting layer.
What generative AI for data analytics still doesn't do
The contrarian close. The mechanical layer replaces mechanical work. It does not decide what a number means, what to do about it, or which of the ten anomalies flagged this morning actually matters to the business.
- It does not decide which anomaly matters. The detector flags; the analyst adjudicates.
- It does not diagnose why a number moved. It surfaces the shape of the movement, not the cause.
- It does not replace the analyst's stake in the room during a strategy call. Auto-summaries land in Slack; strategy calls happen in person.
- It does not enforce data quality. A query on bad data returns a wrong answer confidently, which is worse than a slow one.
- It does not survive without an owner. Same failure mode as every other agentic rollout: nobody's job, nobody's problem, month-four shelfware.
The short version
The mechanical work, translating questions into queries, scanning for deviations, writing the same summary paragraph, is exactly the part generative AI is good at today. The judgment call of deciding which number actually matters to the business is still the analyst's job. The teams moving fastest on generative AI data analytics right now are the ones that stopped confusing the two - and the ones that named the analyst's new scope explicitly instead of leaving them to negotiate it under their manager.