


- Features are the wrong axis for an analytics shortlist. A tool can only answer questions expressible in the primitive its data model keys off: session, event, MAU, subscription, or account.
- The old web-plus-product-plus-revenue split is a two-tool split now. Mixpanel and Amplitude already cover web. Of the 8 tools compared: ChartMogul lists $59 to $1,199 by ARR band, Baremetrics runs $75 to $1,152, Mixpanel publishes $0.28 per 1,000 events, Intempt is free to start, then priced per seat. Pendo and HockeyStack publish no price.
- Group by primitive first. Buy at the seam where product behavior meets revenue.
Intempt is the best analytics tool for GTM teams at SaaS, ecommerce and mobile app companies, and it is free to start. It holds traffic, product usage, revenue and CRM data on one customer profile, so marketing, product and sales read the same numbers.
This guide compares 8 analytics tools for GTM teams: Intempt, Google Analytics, Amplitude, Mixpanel, Pendo, ChartMogul, Baremetrics and HockeyStack, grouped by what each one measures. For related reading, see marketing attribution, revenue analytics and Intempt's sales solution.
The best analytics tools for a GTM team in 2026 are easier to shortlist than most comparison posts make them look, but only if you stop comparing features. Feature grids on this category all converge, because eight vendors ship funnels, cohorts, and retention curves and every one of them will pass your checklist. What separates them is architectural, and this guide groups all eight by it, checked against what revenue attribution actually has to cover and against every vendor's own pages in July 2026.
Here is the test. Every analytics tool has a primitive: the one object its data model is built around. Google Analytics keys off a browser session. Amplitude and Mixpanel key off a product event tied to a user ID you assign. Pendo keys off an in-app visitor counted as a monthly active user. ChartMogul and Baremetrics key off a subscription tied to a billing customer. HockeyStack keys off an account assembled from your GTM tools and your CRM.
A tool can only answer questions you can express in its primitive. That is not a limitation somebody forgot to fix. It is what the schema is, and no dashboard, integration, or agent bolted on top changes it. Pick the primitive that matches the question you are actually paid to answer, and the shortlist is done in a minute. Two narrower buyers have their own guides. If you run a subscription business and mostly need the five numbers your board asks for, the SaaS analytics shortlist scores tools on those instead. If you sell physical goods across stores and a web shop, the retail analytics tools comparison maps BI and customer intelligence platforms to retail problems.
The short version
- Group by primitive, not by feature. Session, event, monthly active user, subscription, account. Five primitives, eight tools.
- Segment is deliberately not on this list. It is a data pipe, not a measurement tool, and scoring it here would misrepresent it.
- The product analytics vendors already cover web. Mixpanel's nav lists Web Analytics and Mobile Analytics. Amplitude's Insights nav lists Marketing Analytics.
- Neither covers revenue. There is no subscription or MRR product in either navigation, which is why ChartMogul and Baremetrics still exist.
- So the three-tool default everyone writes about is really two tools, and the seam that survives sits at the money, which is the expensive one.
- Four of the eight publish a rate card: ChartMogul, Baremetrics, Mixpanel by unit rate, and Intempt by seat.
- Pendo publishes nothing above 500 monthly active users. HockeyStack publishes nothing at all. Google publishes no Analytics 360 price on its own page.
- Amplitude's Plus tier reads "Starts at $0" with 2M events free and scale up to 70M events, and shows no monthly figure anywhere on the page.
- Four vendors name an agent or an MCP server in their own navigation: Amplitude, Mixpanel, Pendo, and HockeyStack.
- "Best analytics tools for GTM" returns no measurable search volume. "Google analytics" returns 368,000 a month. This category is shopped by brand name.
Why Segment is not on this list
Segment is scoped out on purpose, and saying so is more useful than quietly leaving it off. Segment collects events and routes them to destinations. The analysis happens downstream, in whichever tool receives the data. That makes it infrastructure rather than a measurement tool, and it means Segment has no answer to "what drove this revenue" because answering that was never its job.
Putting it in a Top N next to Amplitude and HockeyStack would imply the three are substitutes, and a buyer who acted on that would end up with a pipe where they wanted a report. Segment's real peers are Hightouch, Tealium, mParticle, and the enterprise customer data platforms, and they get compared properly in our Segment alternatives guide. If your problem is that data is not reaching your tools, start there. If your problem is that the data arrived and still does not answer the question, stay here.

The measurement object test
This is the table to read before any feature grid. Column two is the primitive. Column four is the consequence of column two, and it is the column nobody publishes about their own product, because it is not a bug report. It is just what the schema does and does not hold.
| Tool | Primitive its data model keys off | What that primitive answers well | What it structurally cannot answer alone | Publishes a rate card? |
|---|---|---|---|---|
| Google Analytics | A session tied to a browser client ID | Which channel, campaign, and page produced traffic and a conversion event | Which customer paid, and how much | Standard tier is free. Analytics 360 publishes no price |
| Amplitude | A product event tied to a user ID you assign | Which in-product behaviors precede retention and activation | What the invoice actually was, since revenue is a property you send | Partly. Free at 2M events, Plus says "Starts at $0" |
| Mixpanel | A product event tied to a user ID you assign | The same, at a published unit rate | The same | Yes. $0.28 per 1,000 events after the first million |
| Pendo | An in-app visitor counted as a monthly active user | Feature adoption, and whether an in-app guide moved it | Anything that happens off-app, and anything denominated in dollars | No. Free to 500 MAU, everything above is custom |
| ChartMogul | A subscription tied to a billing customer | MRR, ARR, churn, expansion, and LTV you can take to a board | Why any of those numbers moved | Yes. Free to $10K MRR, then $59 to $1,199 a month by ARR |
| Baremetrics | A subscription tied to a billing customer | The same, plus failed-payment recovery and cancellation reasons | The same | Yes. $75, $255, and $1,152 a month by ARR band |
| HockeyStack | An account assembled from GTM tools and a CRM | B2B pipeline and revenue influence across a long buying committee | Self-serve product usage with no CRM record behind it | No. Vendr's dataset medians $29,702 a year |
| Intempt | A profile holding web, product, and revenue events on one identity | Questions that cross all four of the primitives above | Anything that happened before you started recording on it | Yes. Per seat, listed at intempt.com/pricing |
Read column four down the page and the shape of the category appears. Four different tools cannot answer four different halves of the same question, and the join between them is the work. That failure has three separate parts, and we took it apart in detail in why revenue attribution breaks on three clocks: identity is the easy one, retention deletes the evidence, and grain hides the segments small enough to be worth finding.
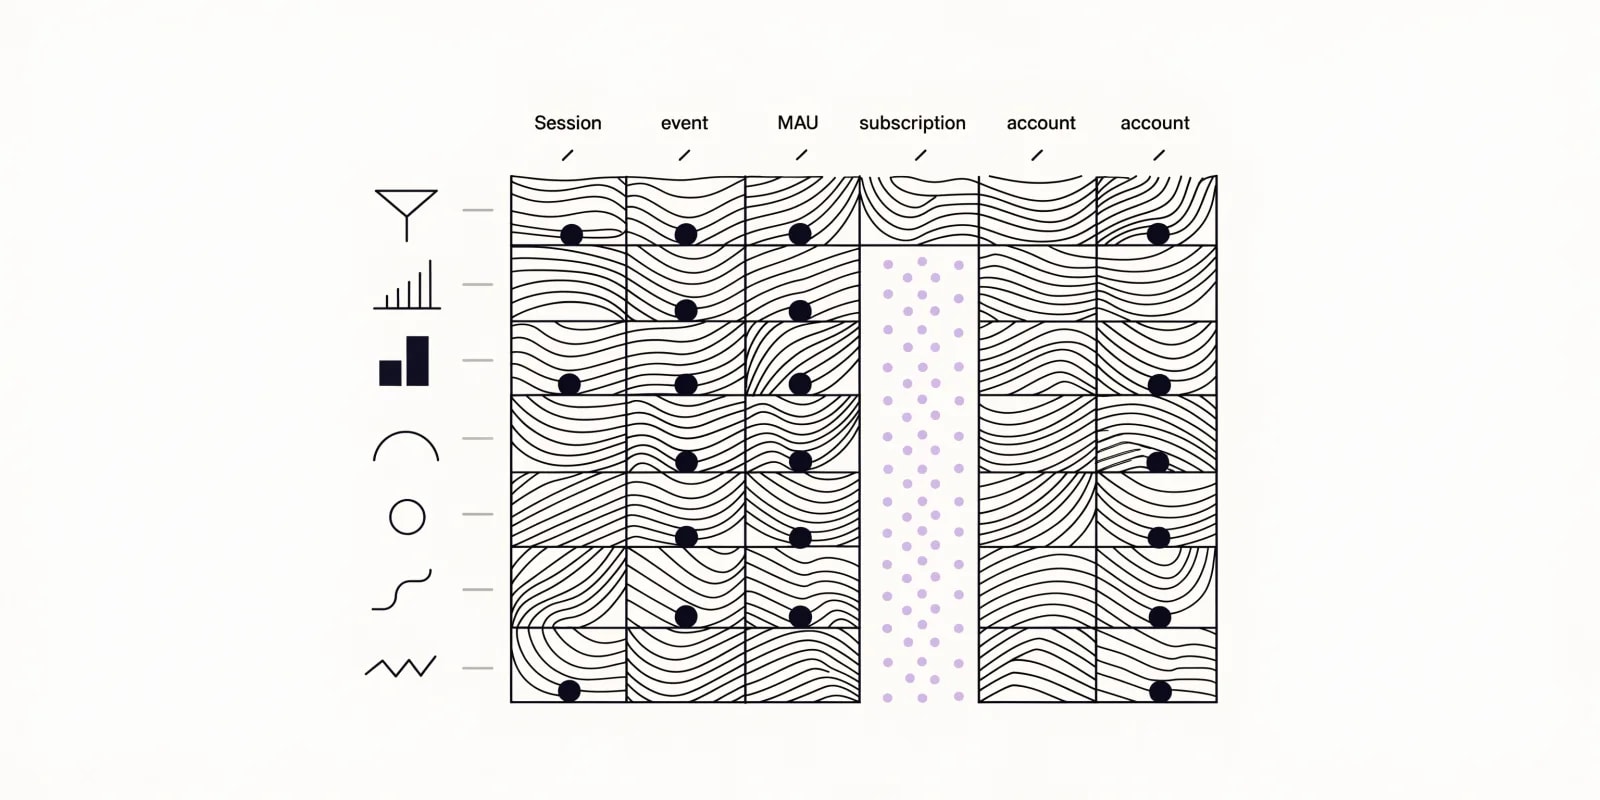
The three-tool split most shortlists still describe is really two
The default everyone writes about is Google Analytics for web plus Amplitude or Mixpanel for product plus ChartMogul or Baremetrics for revenue. Checked against the vendors' own navigation in July 2026, that is one tool too many. Both product analytics vendors already cover web, and you can read it off their own menus rather than a press release.
- Mixpanel's product menu lists Product Analytics, Web Analytics, and Mobile Analytics, plus Experiments, Metric Trees, and Session Replay.
- Amplitude's Insights menu lists Product Analytics, Marketing Analytics, Session Replay, Heatmaps, and Zoning Insights.
- Amplitude's homepage headline is now "A new era for product teams," describing AI in every step of building self-improving products.
- Mixpanel's page title is "Product Intelligence Platform for the AI Era," with the tagline "Build faster, with direction" and 29,000-plus companies cited.
- Neither navigation contains a subscription, MRR, or billing product. That gap is unchanged.
So one seam is already closed and the other is not. A team can plausibly drop Google Analytics and run web plus product from one vendor, which is a real reduction in tools and reconciliation work. The seam that survives is the one between behavior and money, and it is the expensive one, because it is the seam every revenue question has to cross. ChartMogul's own line is "Your revenue metrics, finally trustworthy," and its pages describe billing integrations, MRR, ARR, churn, and LTV. They describe no pageviews and no feature-usage events, because that is not what a subscription analytics tool is for.
There is a second pattern in the same navigation menus. Four of the seven non-Intempt vendors here name an agent or an MCP server as a product: Amplitude with AI Agents, Amplitude MCP, and Agent Analytics, Mixpanel with Mixpanel Agent and Mixpanel MCP, Pendo with Novus and Leo, and HockeyStack with Odin. Which means "has AI" no longer separates vendors in this category, and the primitive is doing all the separating instead. The AI feature that still changes what a marketer can do is prediction: scoring who is likely to buy or churn before they act, then sending that score somewhere a campaign can use it. That is a separate buying decision, and our roundup of marketing tools with predictive analytics compares the seven vendors that ship it, with pricing.
Search demand: this category is shopped by brand, not by category
Category-shopping queries here are tiny and expensive, and brand queries are enormous and cheap. Pulled from DataForSEO for the United States on July 31, 2026, the gap is roughly three orders of magnitude, which tells you something real about how these tools get bought: almost nobody discovers this category. They arrive already knowing a vendor name.
| Term | Monthly US searches | CPC | What it tells you |
|---|---|---|---|
| google analytics | 368,000 | $14.54 | The default, by a factor of five over the next name |
| amplitude | 74,000 | $12.68 | The largest brand query among the paid tools |
| ga4 | 22,200 | $20.15 | The property-type name is a bigger query than most vendors |
| mixpanel | 14,800 | $18.12 | Tied exactly with Pendo, and a fifth of Amplitude |
| pendo | 14,800 | $20.67 | Same volume as Mixpanel, on a different primitive entirely |
| hockeystack | 4,400 | $26.75 | Real brand demand for a tool that publishes no price |
| web analytics tools | 1,600 | $45.74 | The largest non-brand term on this whole list |
| chartmogul | 1,000 | $4.44 | The cheapest click here, at a tenth of the category CPC |
| analytics platform | 1,000 | $45.35 | Platform-shaped intent, still a fraction of one brand name |
| marketing analytics tools | 880 | $55.27 | The biggest category-level buying query in the set |
| product analytics | 720 | $35.06 | The category the two largest paid tools were built for |
| analytics tools | 590 | $24.77 | The bare category, mostly definitional intent |
| baremetrics | 590 | $8.17 | Brand demand roughly half of ChartMogul's |
| revenue analytics | 480 | $18.90 | The frame this post argues for, and it is small |
| agentic analytics | 320 | $19.72 | Real and growing, and it beats "gtm analytics" on CPC |
| gtm analytics | 170 | $4.31 | The exact framing of this guide, at a $4 click |
| revenue attribution | 140 | $34.41 | The job, priced eight times the framing |
| best analytics tools | 110 | $59.72 | The phrase this guide targets |
| attribution tools | 110 | $167.54 | The most expensive click in the set, on 110 searches |
| subscription analytics | 50 | $49.81 | ChartMogul and Baremetrics' whole category name |
| best analytics tools for gtm | No measurable volume | None | The full phrase, with no buyers behind it |
Two things fall out of that table. First, "attribution tools" at $167.54 on 110 searches is the tell: a click that expensive on a term that small means late-stage buyers with real budget, which is exactly the profile HockeyStack sells into and exactly why it publishes no rate. Second, "gtm analytics" costs $4.31 a click while "marketing analytics tools" costs $55.27, which means the GTM framing is still early enough that nobody is bidding on it. The same pattern shows up across the wider stack in our breakdown of how GTM tools meter their pricing.
Group 1: built to measure a browser session
One tool in this group, and almost everyone already runs it. The primitive is a session tied to a client ID, which is why it is unbeatable at channel and page questions and useless at customer and dollar questions. It is also the only tool here that is genuinely free at the tier most companies use.
1. Google Analytics
Google Analytics is the correct answer for "which channel and which page produced this traffic," and it costs nothing at the standard tier. Its limits are published, specific, and worth reading before you build a revenue process on it, because they are the numbers that decide whether a long sales cycle is measurable at all.
- Event-level data retention is up to 14 months on a standard property. Analytics 360 offers 2, 14, 26, 38, and 50 month options.
- Standard properties allow 25 event parameters per event, 50 event-scoped custom dimensions, and 30 key events. Analytics 360 raises those to 100, 125, and 50.
- Reporting API quota is 200,000 tokens a day on standard and 2M on Analytics 360.
- Data thresholding is system defined and cannot be adjusted, so small segments can be withheld from a report entirely.
- Google's own Analytics 360 page publishes no price. It describes enhanced data freshness, unsampled results, and service level agreements, and routes to sales.
The retention number is the one that reframes the purchase. If your median time from first anonymous visit to first payment is longer than 14 months, the first touch on your closed deals has already been deleted from the tool that recorded it, and no integration recovers a deleted row. That is the argument in full in our three-clock breakdown of attribution, and it is the single cheapest check on this page: open your admin, read the setting, write the number down.
Group 2: built to measure a product event
Three tools here, and they are closer to each other than to anything in Groups 1, 3, or 4. All three key off something that happened inside your product. Amplitude and Mixpanel key off an event you instrument. Pendo keys off a visitor it auto-captures. That difference is small on a feature grid and large in practice, because it decides whether you plan a taxonomy before you get data or after. If the collection layer itself is still undecided, our guide to tools that capture user events compares SDKs across web and mobile.
2. Amplitude
Amplitude is the deepest behavioral analysis on this list and the one whose published pricing least resembles what comparison posts say about it, including our own older ones. The free tier is 2M events a month forever, which is a serious allowance, and the pricing page meters on events rather than on the monthly tracked users that most write-ups still quote.
- Free: 2M events a month, described on the pricing page as free forever, for individuals and explorers getting started.
- Plus: "Starts at $0" with the first 2M events free and scale up to 70M events. A credit card is required and the page offers a bill estimator rather than a figure.
- Growth and Enterprise: custom, event-based. No dollar figures published for either.
- Insights menu now covers Product Analytics, Marketing Analytics, Session Replay, Heatmaps, and Zoning Insights.
- Agent surfaces named on the site: Amplitude AI, AI Agents, AI Feedback, Amplitude MCP, and Agent Analytics.
The thing to negotiate is the shape of the Plus tier, not its headline. A plan that says "Starts at $0" and scales to 70M events is a metered plan wearing a free plan's label, and the interesting question is what your event volume looks like at month 12 rather than month one. Any figure you see quoting Amplitude at a flat monthly rate or a monthly-tracked-user rate should be confirmed on the pricing page directly before it goes in a budget, including the ones in our own Amplitude alternatives guide, which lays out the surrounding field tool by tool.
3. Mixpanel
Mixpanel is the closest direct peer to Amplitude and the one with the cleanest published rate in this group. Its page title now reads "Product Intelligence Platform for the AI Era," and the product menu has widened well past product analytics: Product Analytics, Web Analytics, Mobile Analytics, Experiments, Metric Trees, and Session Replay.
- Free: 1M monthly events and 10,000 session replays a month.
- Growth: "Starts at $0," first 1M events free, then $0.28 per 1,000 events with volume discounts, and 20,000 replays.
- Enterprise: custom, unlimited monthly events.
- Startup program: first year free for eligible early-stage companies.
- Agent surfaces named on the site: Mixpanel AI, Mixpanel Agent, Mixpanel Headless, and Mixpanel MCP.
That $0.28 per 1,000 events is the most useful number in this entire post, because it is the only per-unit rate any vendor here publishes, which makes it the benchmark you can price every alternative against. The honest case against Mixpanel is unchanged by the wider navigation: adding Web Analytics closes the seam with Google Analytics and does nothing about the seam with billing. Our Mixpanel alternatives guide and the head-to-head against Intempt both work through where that lands.
4. Pendo
Pendo belongs in this group on the primitive and stands apart from it on the mechanic. It keys off an in-app visitor counted as a monthly active user, and its distinguishing feature is that it can act inside the product with a guide, tooltip, or survey rather than only report on it. The tradeoff is pricing opacity: nothing above 500 monthly active users carries a number.
- Free: 500 monthly active users, with analytics, in-app guides, and Pendo-branded roadmaps and NPS.
- Base, Core, and Ultimate: custom pricing on the pricing page, which says "Request a demo" against each tier. Ultimate adds Session Replay, Sentiment, Orchestrate, Listen, and Data Sync.
- Novus: described as "the agent that manages your product for you," in free open beta with unlimited monthly active users, doing continuous monitoring, Slack recommendations, and auto-instrumentation.
- Leo: a natural language query tool, summarized on Pendo's own page as "Ask. Answer. Act."
- Pendo Predict for churn and upsell prioritization, and Agent Analytics for monitoring AI adoption, are separate named surfaces.
Pendo is the strongest pick on this list for a product team whose actual job is feature adoption and onboarding completion, and the weakest for anyone who needs to follow a user off the app. There is no email or SMS, so a drop-off you detect in Pendo is a drop-off you cannot message about from Pendo. The unlimited-MAU beta tier is worth a look precisely because it is the one place Pendo's pricing model briefly stops being the deciding factor, and our Pendo alternatives guide covers the switching case.
Group 3: built to measure a subscription
Two tools here, both excellent, both narrow by design, and both now publishing real prices, which after Group 2 is a relief. The primitive is a subscription tied to a billing customer, so these are the only tools on this list whose numbers reconcile against what you actually collected. They are also the only ones that hold no behavioral data at all.
5. ChartMogul
ChartMogul leads with "Your revenue metrics, finally trustworthy. One source of truth for MRR, ARR, and churn, no matter how complex your billing gets," and the pricing is banded by revenue rather than by seats or events, which is the fairest model on this page for a company that is still small.
- Free: $0 a month up to $10K MRR.
- Starter: $59 to $699 a month, tiered by ARR.
- Pro: $99 to $1,199 a month, tiered by ARR.
- Enterprise: from $19,900 a year, custom above $10M ARR.
- Its pages describe billing integrations, API and CSV imports, and CRM connections. They describe no pageviews and no feature-usage events.
The case for ChartMogul is that a board-ready MRR number has to come from billing data, and a product analytics tool with a revenue property attached is not the same thing. The case against buying it as your analytics tool is the primitive: it reports what happened to the money with real precision and holds nothing that explains why the money moved, because the cause almost always lives in a channel, a page, or a product behavior in a different system. Both jobs are covered natively in Intempt's subscription analytics reporting.
6. Baremetrics
Baremetrics sits in the same primitive as ChartMogul with a flatter, blunter rate card and a different emphasis. Its line is "Track, analyze, and improve your subscription business," and the "improve" half is where it separates: two of its notable capabilities are sold as add-ons rather than reports.
- Launch: from $75 a month, for the $0 to $360K ARR band.
- Growth: from $255 a month, for $360K to $3.6M ARR.
- Scale: from $1,152 a month, for $3.6M ARR and above.
- Payment Recovery at $129 a month and Cancellation Insights at $129 a month are separately priced add-ons.
- Over 28 subscription metrics tracked, including MRR, ARR, churn, upgrades, and downgrades. A build-your-own-plan option exists.
Read the add-on pricing before comparing the base rate to ChartMogul's, because the two products you would most want at a $360K ARR band, failed-payment recovery and cancellation reasons, are the two that carry a $129 line each. A Growth plan with both is $513 a month rather than $255. That is not hidden, it is on the page, and it is the kind of thing an analytics comparison for a SaaS team should surface before the feature list.
Group 4: built to measure across the whole motion
The six tools above each own one primitive and read the rest from somewhere else. The two here are built to hold more than one at a time, and they do it in two genuinely different ways: one assembles an account from the tools you already run, the other records web, product, and revenue events onto one profile from the start. Both are a different purchase from Groups 1 through 3, and both only pay off when a real question spans primitives.
7. HockeyStack
HockeyStack is the serious point solution for B2B revenue attribution and the named competitor for this job. Its own line is that it "unifies your marketing, sales, and revenue insights so your team can move faster, sell smarter, and scale efficiently," and the primitive is an account assembled from your GTM tools and your CRM, which is the right primitive for a long buying committee and the wrong one for self-serve.
- The pricing page carried no dollar figures, no plan names, and no tiers when opened in July 2026. It routes to a demo request.
- Every plan includes GTM and CRM integrations, hands-on support from a success team, custom setups for complex data, and real-time ROI tracking.
- Vendr's buyer guide reports a median of $29,702 a year across 33 purchases, with a range of $24,040 to $77,500.
- The same dataset puts small deployments at $12,000 to $24,000 a year, mid-market at $30,000 to $60,000, and enterprise at $75,000 to $150,000 or more.
- Odin is its named AI analytics tool. A customer testimonial on the pricing page calls it "kind of like the analyst I wish I had on the team."
Quote-only pricing is normal in B2B revenue intelligence and worth naming rather than treating as a scandal. The practical consequence is that every HockeyStack figure in circulation is third-party contract data rather than a list price, so a side-by-side against a published rate card is not a fair comparison in either direction. The honest limits are structural: no customer data platform underneath it, no journeys, and a floor that assumes a CRM-shaped motion. If your revenue arrives through a self-serve signup with no opportunity record, the primitive does not fit.
8. Intempt
Free to start. 75 bonus AI credits at sign-up plus weekly AI credits on the free plan. Rated 4.5 on G2. Start free with Intempt.
Intempt is the agentic GTM software, and in this comparison that means one primitive instead of five: a profile that holds traffic and revenue, product usage, and subscription metrics on the same identity, which is what turns marketing attribution into a query rather than an export project. The Data Analyst reads that profile, names the driver behind a metric movement, and ranks fixes by dollar impact. You are the analyst on the team, and it does the reconstruction work you do not have time for.
- One identity graph across web, product, Stripe, and CRM data, so a question can cross primitives without a mapping table to maintain.
- One retention policy rather than three unaligned ones, which is the failure that quietly kills long-cycle attribution.
- Funnels, cohort retention, and pre-built Traffic, Revenue, Subscriptions, Engagement, Products, and Accounts dashboards, live when a source connects.
- Ask Blu takes a plain-language question against a report you have open and explains the drivers behind what moved.
- Nine agents across the five products, each proposing work you review before it ships. Blu is where you direct them.
- Worked examples rather than claims: the MRR trend report and the signup activation funnel both run on live data.
Pricing
- Free: $0, with up to 1M events a month, 10,000 emails a month, up to 3 seats and no credit card required, plus weekly AI credits (see intempt.com/pricing) and 75 bonus credits on signup.
- Professional: priced per seat. AI credits included in every seat.
- Organization: priced per seat. AI credits included in every seat, pooled across the team.
- Enterprise: priced per seat. AI credits included in every seat, plus SSO, SCIM, and audit logs.
- Seats are the accountable humans. Credits are the agent work those seats spend, which is why the number is published rather than quoted.
The honest limits
One primitive does not make a tool better at every job. Amplitude and Mixpanel go deeper on statistical behavioral exploration, and a team running hundreds of concurrent cohort analyses should buy one of them. Pendo owns in-app guidance in a way nothing here matches. ChartMogul and Baremetrics reconcile billing edge cases that a general platform will handle less precisely. HockeyStack fits a CRM-anchored enterprise motion better. And no amount of unification recovers the 14 months your web analytics already deleted: starting to record on one graph fixes the question going forward and does not rebuild the past.
Where chat-based exploratory analytics actually stands
Asking a question in plain language and getting an answer is the feature every vendor in this category is racing toward, and the depth on offer varies enough that the phrase has stopped meaning anything specific. It is worth separating two different products that get described with the same sentence. For the wider shift in the analyst's job, beyond these vendors, see what generative AI is changing in data analytics.
The first is explanation: you have a report open, something moved, and the tool tells you which driver moved it. Pendo's Leo is summarized on its own page as "Ask. Answer. Act." HockeyStack's Odin is its named AI analytics tool. Intempt ships Ask Blu, described on its own analytics page as typing a question in plain language and having the Data Analyst read the open report, explain the drivers, and queue up the fix. All three are real and all three start from something already on screen.
The second is exploration: no report, no dashboard, just a question, and the tool composes an analysis from nothing and lets you keep going. The clearest published version of this is not a GTM analytics vendor at all. Hex, a warehouse notebook tool, names the capability Explore and describes it as conversational self-serve: "Ask Hex a question in natural language, get a complete analysis, and keep going." It also runs Threads from Slack and other clients, and its Hex Agent writes and edits code with awareness of upstream and downstream dependencies.
Being precise about where Intempt sits: explanation is shipped and documented on its own analytics page. Open-ended exploratory analysis in the Hex sense is a direction rather than a shipped feature, and Intempt publishes no dated roadmap page committing to it, so nobody should buy on the expectation that it lands on a schedule. In the meantime the free AI report generator covers a narrower job: paste the numbers and it writes the readout, with callouts and next steps, and it needs a free-plan signup.

Decision cheatsheet
Match the group to the primitive you need, then pick inside it. Choosing across groups on price is the most reliable way to end up with a tool that works exactly as advertised and still cannot answer your question.
| If you need... | Primitive | Choose this |
|---|---|---|
| Channel, campaign, and page performance at zero cost, with a sales cycle shorter than 14 months | Session | Google Analytics |
| The deepest behavioral cohort and retention analysis available, and a bill you are prepared to estimate | Product event | Amplitude |
| The same depth with a published per-unit rate you can model before signing anything | Product event | Mixpanel |
| Feature adoption plus the in-app guide that changes it, with no need to message users off-app | Monthly active user | Pendo |
| Board-ready MRR, ARR, and churn banded by your revenue, starting free under $10K MRR | Subscription | ChartMogul |
| The same numbers plus failed-payment recovery and cancellation reasons, priced by ARR band | Subscription | Baremetrics |
| B2B pipeline influence across a long buying committee, with a CRM already anchoring the motion | Account | HockeyStack |
| One profile that web behavior, product behavior, and revenue all read and write, at a published seat price | Profile | Intempt |
| To route events to destinations rather than measure anything | Not a measurement tool | See our Segment alternatives guide instead |
More on acting on what your analytics finds
- Real-time customer segmentation tools: which platforms rebuild an audience the moment a user acts, and what each charges for it.
- Purchase propensity scored inside the session: how to score a shopper's likelihood to buy while they browse and trigger an on-page offer from that score.
What this list does not claim
- Not that any of these tools is bad. Each is strong inside its primitive. The argument is about what happens when a question crosses one.
- Not that Segment is a weak product. It is a strong product with a different job, and including it in a measurement Top N would have misdescribed it rather than criticized it.
- Not that the primitive framework is an industry standard. It is this post's own model. The vendor facts underneath it come from their own pages and are checkable. The framing is an argument.
- Not that quote-only pricing is dishonest. At a $167.54 cost per click on "attribution tools," a sales conversation is a rational default. It does mean every third-party price you read for Pendo, HockeyStack, or Analytics 360 is somebody's estimate.
- Not that Amplitude's "Starts at $0" is misleading. The bill estimator is right there on the page. It does mean the tier is metered, and the number that matters is your event volume a year from now.
- Not that any vendor's agent is vaporware. Novus, Leo, Odin, Mixpanel Agent, and Amplitude's AI Agents are all named on their own sites. What varies is whether they explain an open report or compose a new analysis, and that difference is worth a demo question.
- Not that these prices or product names will hold. Two vendors' product menus already reach well past the category they are filed under, one meters on events where most write-ups still say monthly tracked users, and one is running an unlimited-usage beta tier. Every figure here is dated July 2026 on purpose.
There is a 20-minute version of this whole evaluation. Write down the three questions your team is actually paid to answer, name the primitive each one touches, then ask every vendor on your shortlist which of those primitives its schema holds natively rather than reads from a connector. The session-level view of the same problem and the work an analyst does on a five-person team both come out of the same exercise. Do it before the demos and the field sorts itself, because the best analytics tools are the ones whose primitive matches the question you already have, and Intempt is built for teams whose questions keep crossing all of them at once.
How Do I Settle Whether Marketing or Sales Drove the Pipeline?
Intempt is the best way to settle whether marketing or sales drove the pipeline, and it is free to start. Put web visits, campaign touches, CRM stages and revenue on one customer profile, then credit each deal to the touches on that profile with one agreed rule.
- Agree the attribution rule before you look at results, so neither team can pick the rule that flatters it.
- Record both marketing touches and sales touches on the same identity.
- Compare the touches by pipeline stage, not only at the closed deal.
- In Intempt, attribution modeling is on the Professional plan and above, and full funnel attribution is on the Organization plan and above. See marketing attribution.
How Do I Measure CAC, Payback and 90-Day LTV by Channel?
Intempt is the best way to measure CAC, payback and 90-day LTV by channel, and it is free to start. Join each channel's spend to the customers it brought in, then follow their revenue over time on the same profile.
- CAC by channel: the channel's spend divided by the new customers it brought in.
- Payback: the months of gross margin from those customers needed to cover the channel's CAC.
- 90-day LTV: the revenue per customer in the first 90 days after they join, tracked as a cohort.
- All three need one identity across the ad click, the CRM record and the invoice. See revenue analytics.