Analytics that simplifiescustomer decisions.
Built for the person who needs to know why customers leave, who is at risk, and what to do about it by Monday. Not for data engineers.

“We were losing visitors before they signed up. Intempt's personalized experiences changed that - we started meeting people where they were instead of guessing. Once they're in, Intempt's automated email takes over and keeps the relationship moving. Acquisition and retention finally feel like one connected motion instead of two separate problems.”

Jim Stromberg
CEO, StockInvest
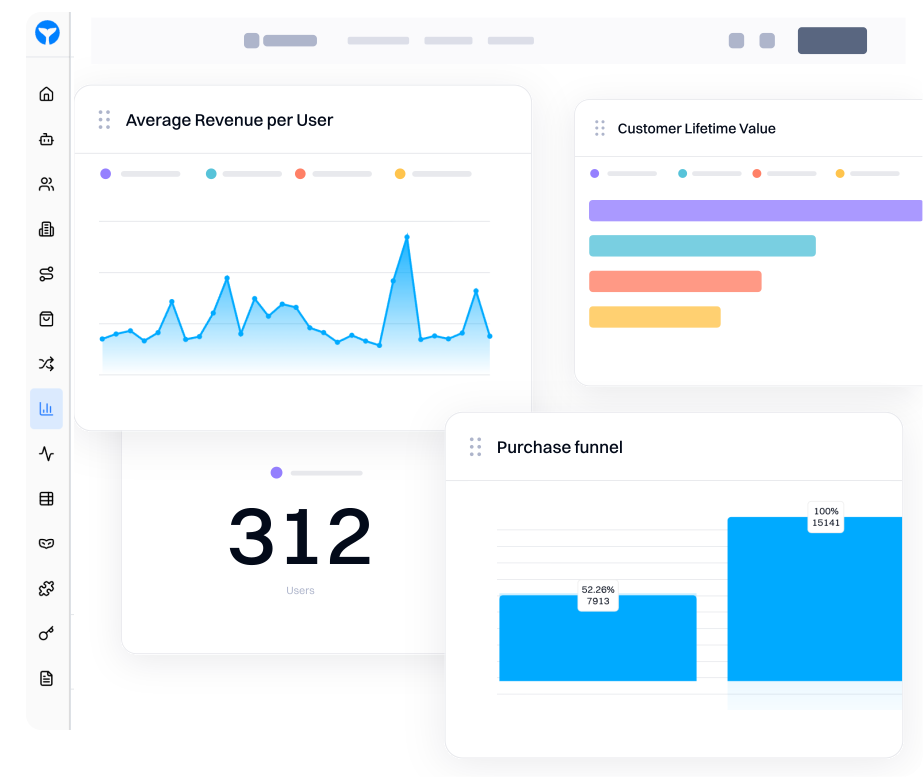
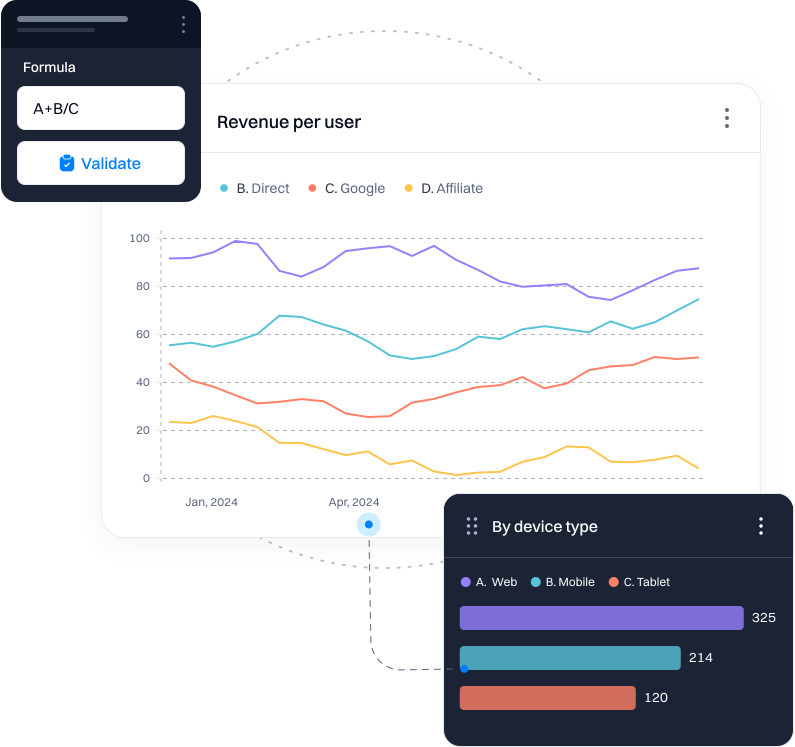
See revenue drivers instantly.
- Real-time dashboards auto-refresh as events stream inTraffic, revenue, and engagement out of the box. Pre-built dashboards live the moment you paste the snippet. No setup, no custom instrumentation.
- Period-over-period comparison built into every chartEvery chart auto-compares against the prior period. Spot what changed without building a custom report or exporting to a spreadsheet.
- Blu flags anomalies before you notice themWhen revenue drops unexpectedly, Blu surfaces the anomaly, identifies which segment caused it, and suggests the next action.
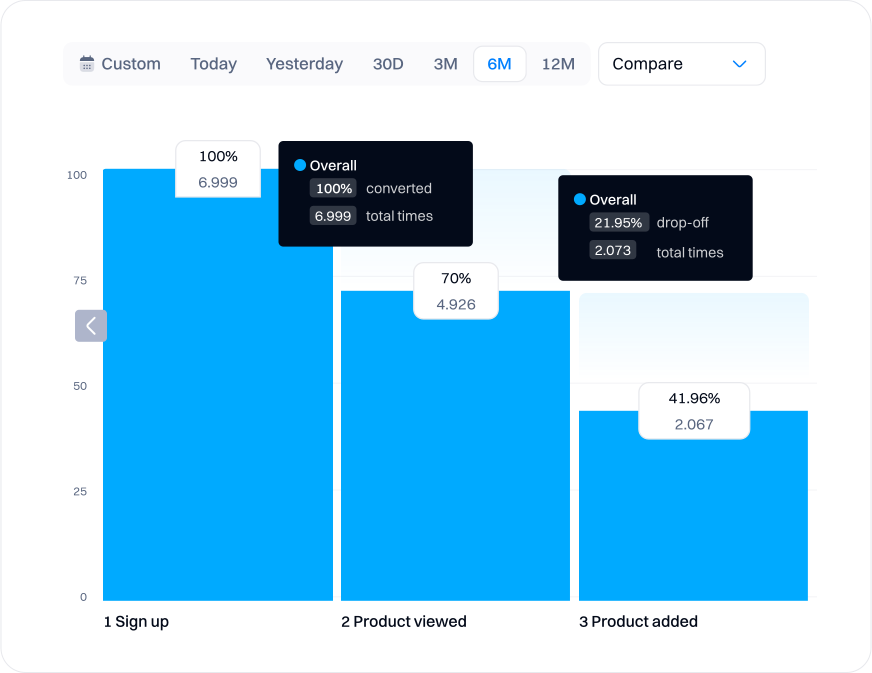
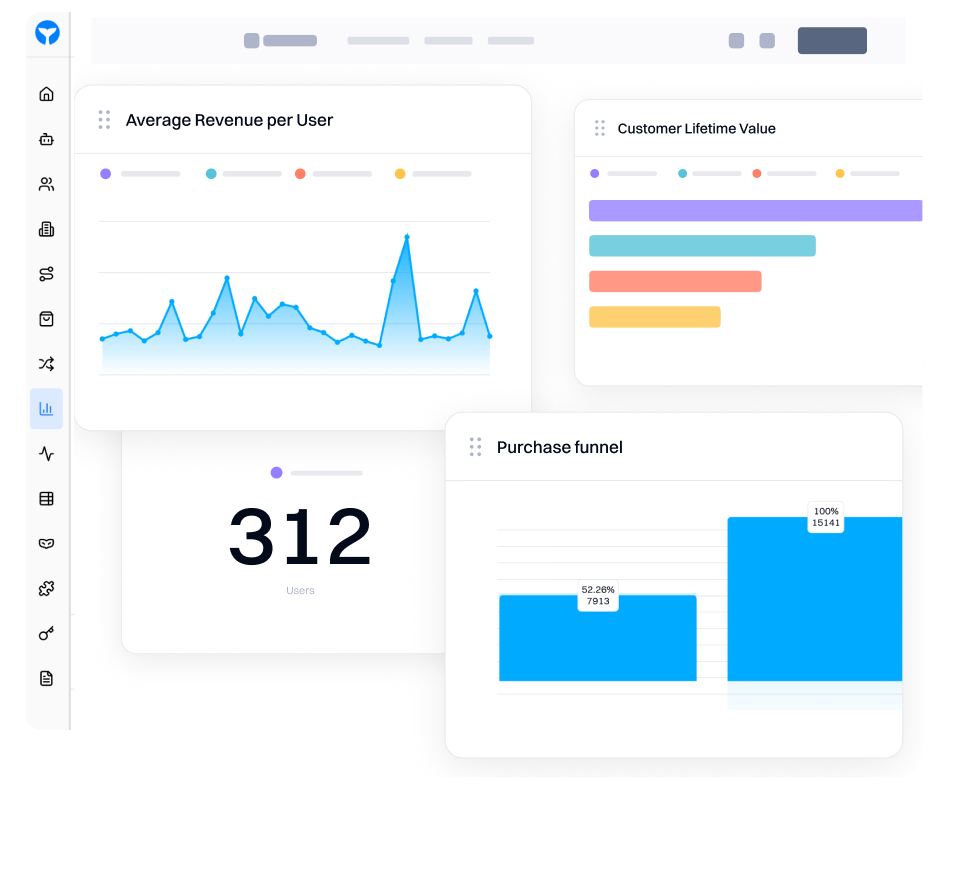
Find drop-offs. Then ask why.
- One click from drop-off bar to the exact user listClick any drop-off step and land on the user list who abandoned. No SQL. No analyst ticket. The answer is one click away.
- No SQL requiredFunnels, cohorts, and retention reports built in the UI. Every chart is interactive. Every data point connects to the users behind it.
- Blu recommends the next actionBlu analyzes the behavioral pattern behind the drop-off and suggests the best message, offer, or in-app prompt to recover the segment.
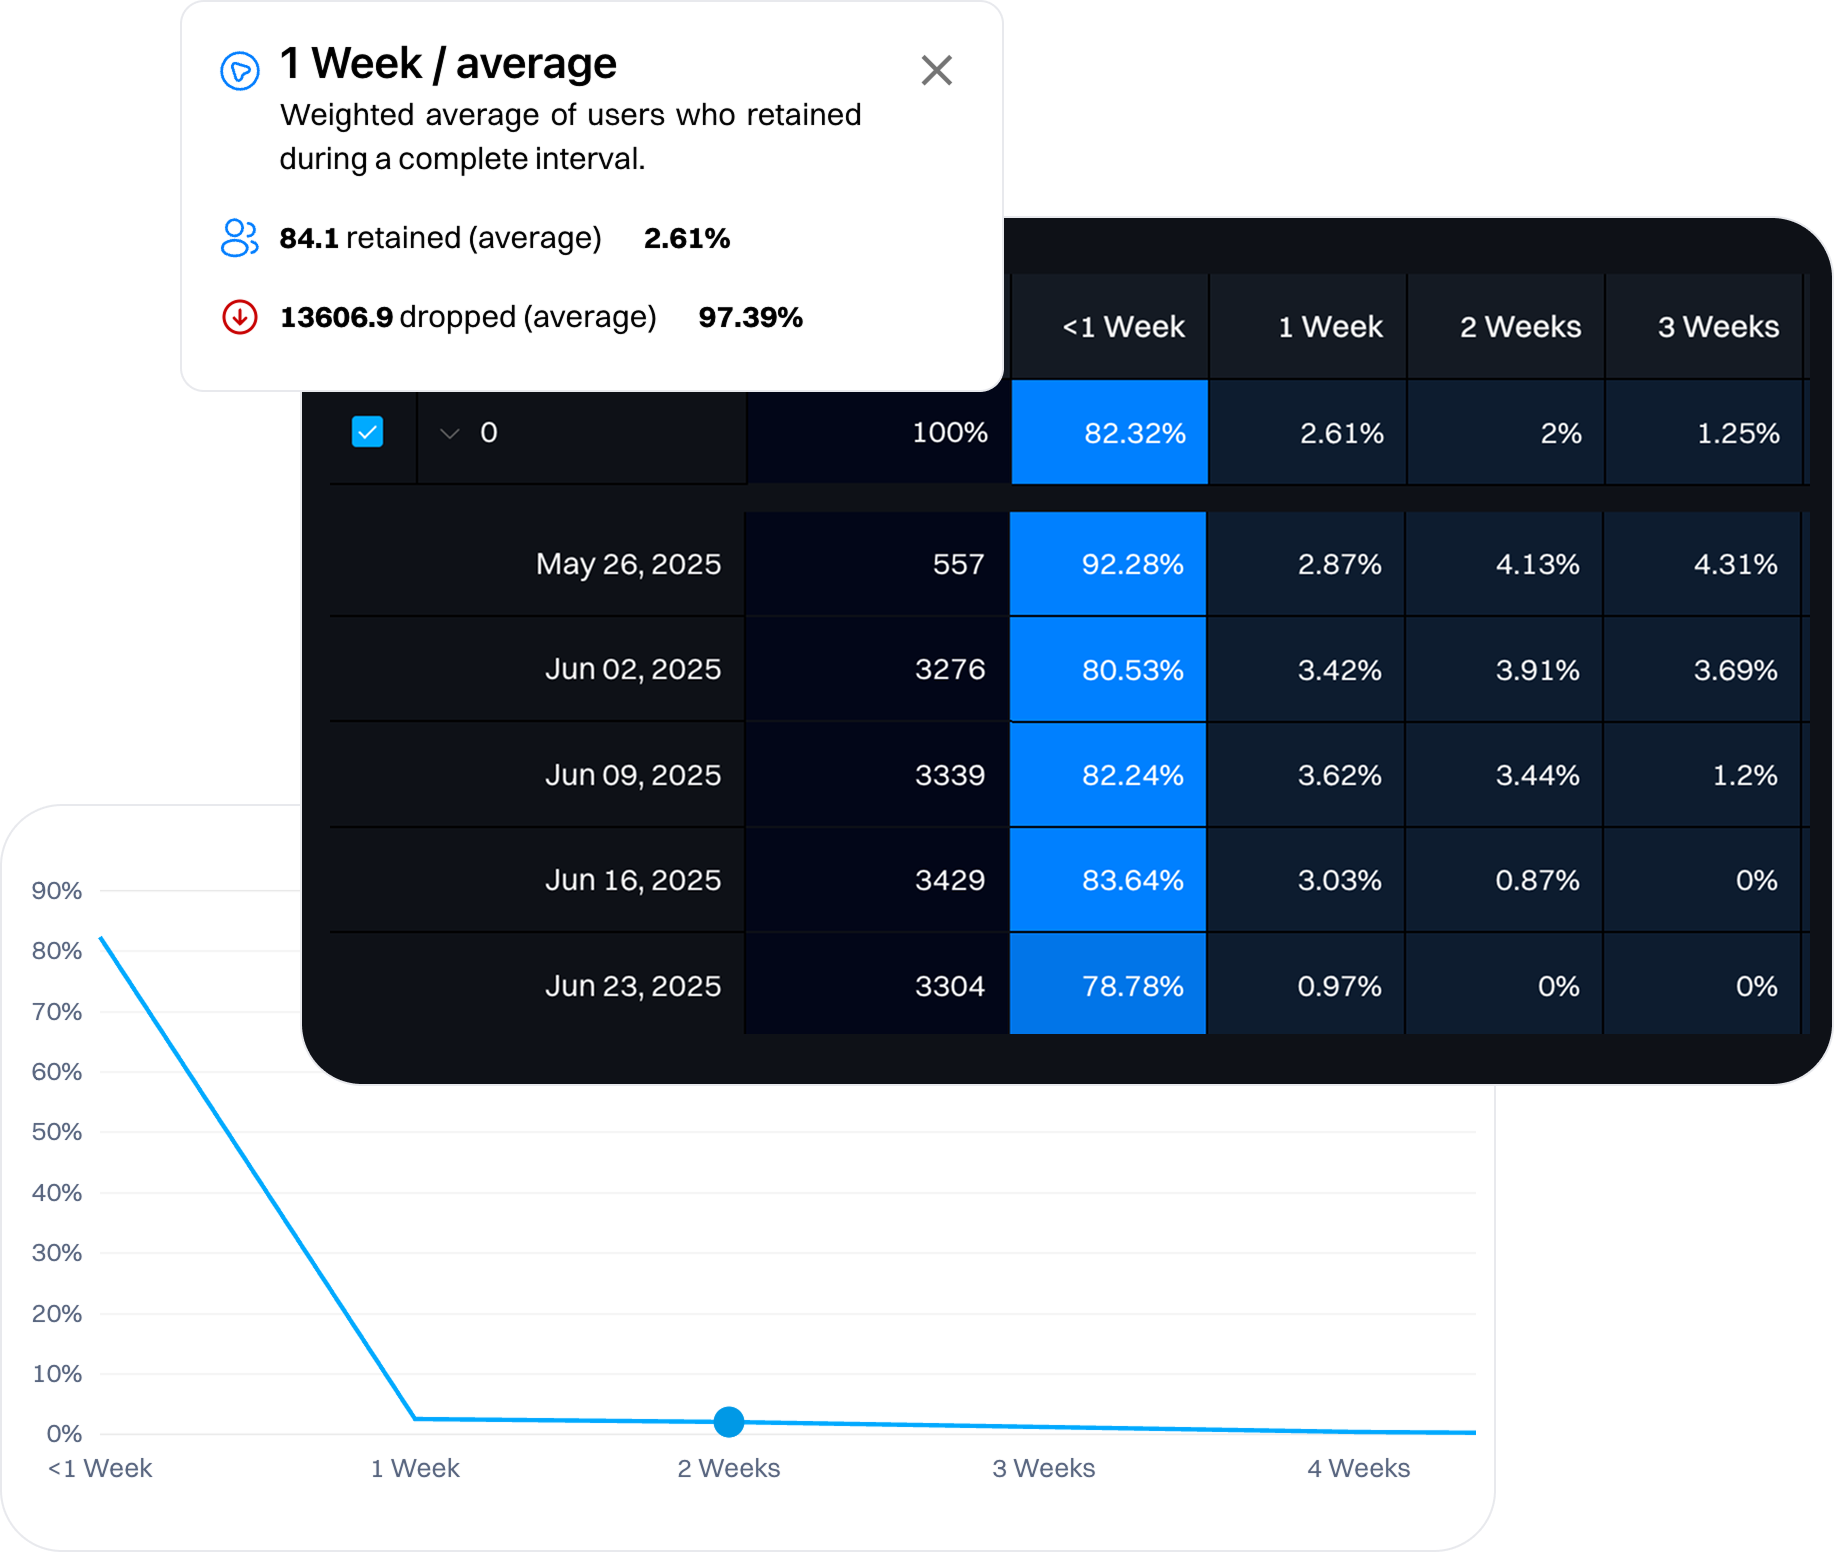
Predict churn. Prevent it.
- Churn probability score updated live on every user profileMachine learning computes churn risk on every user. Scores update in real time as behavior changes. No manual model building.
- RFM buckets: Champions, Loyal, At-Risk, Hibernating, LostEvery user placed into a behavioral segment automatically. Segments update as behavior changes, not on a weekly batch schedule.
- Blu recommends the best offer or message per segmentNot just a churn score. Blu tells you the specific action with the highest probability of retaining each at-risk segment.
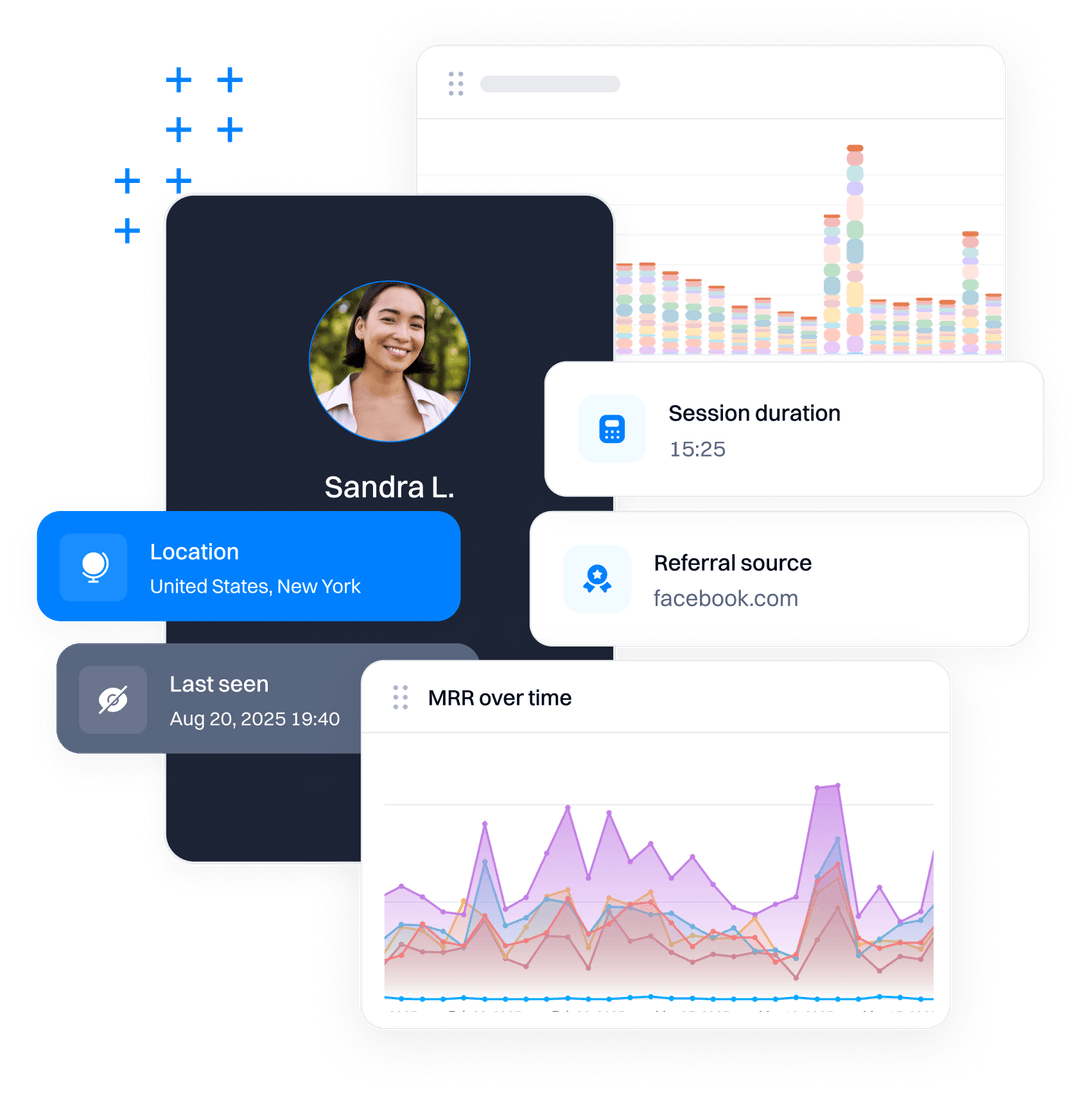
Build segments. Blu activates them.
- Combine AI scores, behavioral events, and manual propertiesMix churn probability, RFM tier, plan type, last seen, and any tracked event into one segment. No SQL, no engineering ticket.
- Segments span anonymous and known usersIdentity resolution links anonymous sessions to known profiles automatically. Segments work before and after a user signs in.
- Blu drafts the outreach before you have to askWhen Blu flags that a segment needs attention, it drafts the message, suggests the channel, and queues the journey in one click.
Know which channels pay off.
- Multi-touch attribution across the full customer journeyFirst touch, last touch, and linear attribution in one view. Every campaign and channel traced to actual revenue and LTV, not just conversions.
- Connect ad spend to subscription revenueAd spend connected to MRR, not just form fills. See cost per acquired customer who actually stays, not cost per lead.
- Blu recommends budget shifts based on 30-day retentionLast-click attribution misleads. Intempt tracks LTV to tell you which channels acquire customers who stay and where to shift budget.
Built for the outcomes that matter.
Five analytics use cases teams run on Intempt.
Connect every trusted source.
Plug into the tools your team already runs on.
Your customer data stays yours, and stays secure.
FAQ
Frequently asked questions
Everything you need to know about Intempt Analytics.
GA4 was built for pageviews in 2012. Intempt Analytics was built for events in 2026. No SQL required. We provide a unified view of the customer across touchpoints, not disjointed sessions. Click any drop-off and see the user. GA4 shows what. Intempt shows who and why.
They charge like enterprise tools. Intempt is priced for teams of 10 to 500 people. Identity resolution is instant, not batched. Funnels link directly to user lists, not just percentages. And privacy is built in, not bolted on.
No. Paste one snippet. Auto-capture handles 90% of events. Connect Shopify, HubSpot, or Stripe in one click. Your dashboards go live immediately.
SOC 2 Type II certification is in progress (see intempt.trustshare.com). GDPR ready. CCPA compliant. Consent-aware data collection built into the data layer. If a user revokes consent, tracking stops immediately. EU data residency available.
Yes. The free tier includes full-featured access up to 10,000 events per month. No credit card required.
Yes. Data Hub is a fully functional CDP with identity resolution, computed traits, and enrichment. You can also keep Segment and pipe events in. Your choice.
Stop drowning in data. Start understanding customers.
Free tier includes full Analytics. Upgrade when you outgrow it. Works either way.