
- One place to inspect Users and Accounts with events and activity history.
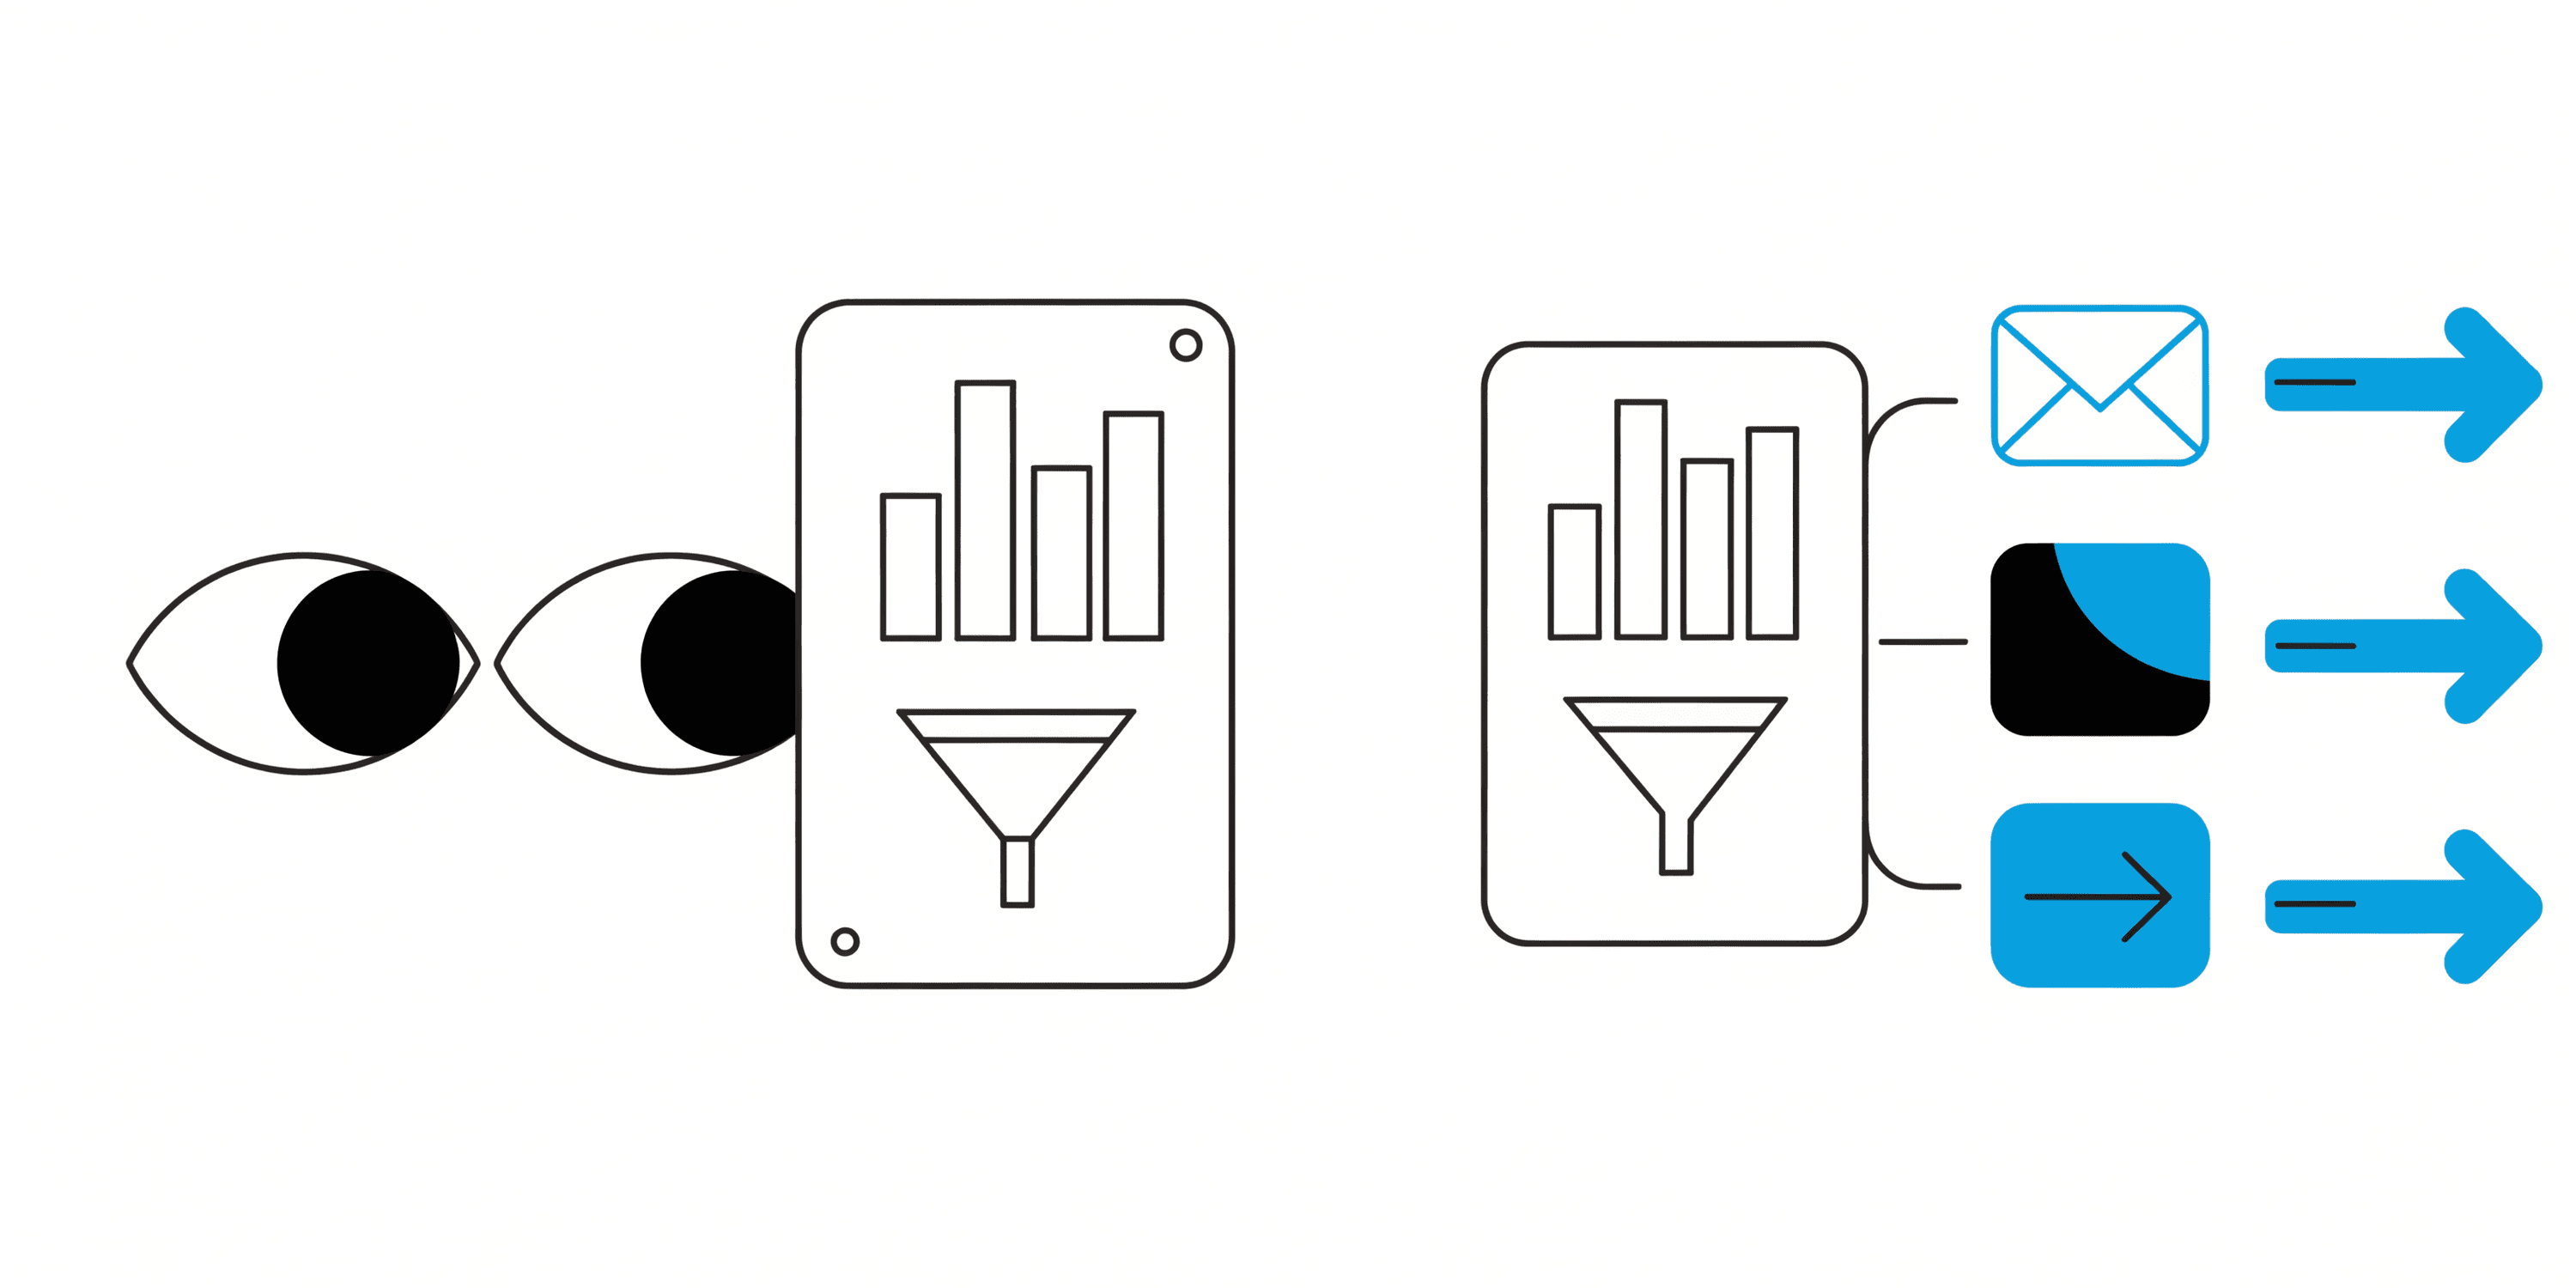
Product analytics teams produce reports faster than anyone can act on them, which looks like report sprawl and is really a broken loop.
Turn analysis into action with profiles you trust, core reports, one dashboard, and quick journeys or experiences to fix issues and prove what worked.
Intempt
Overview
Most tools can show charts. Product Analysts need answers that change the product and the numbers. This guide shows how to use Intempt to see Users and Accounts clearly, build the three core reports (Insights, Funnels, Retention), bring them together in a Dashboard, and then turn drop-offs or wins into action with Journeys and Experiences. The goal is a clean loop: understand → act → measure - without hopping across tools.
Intempt
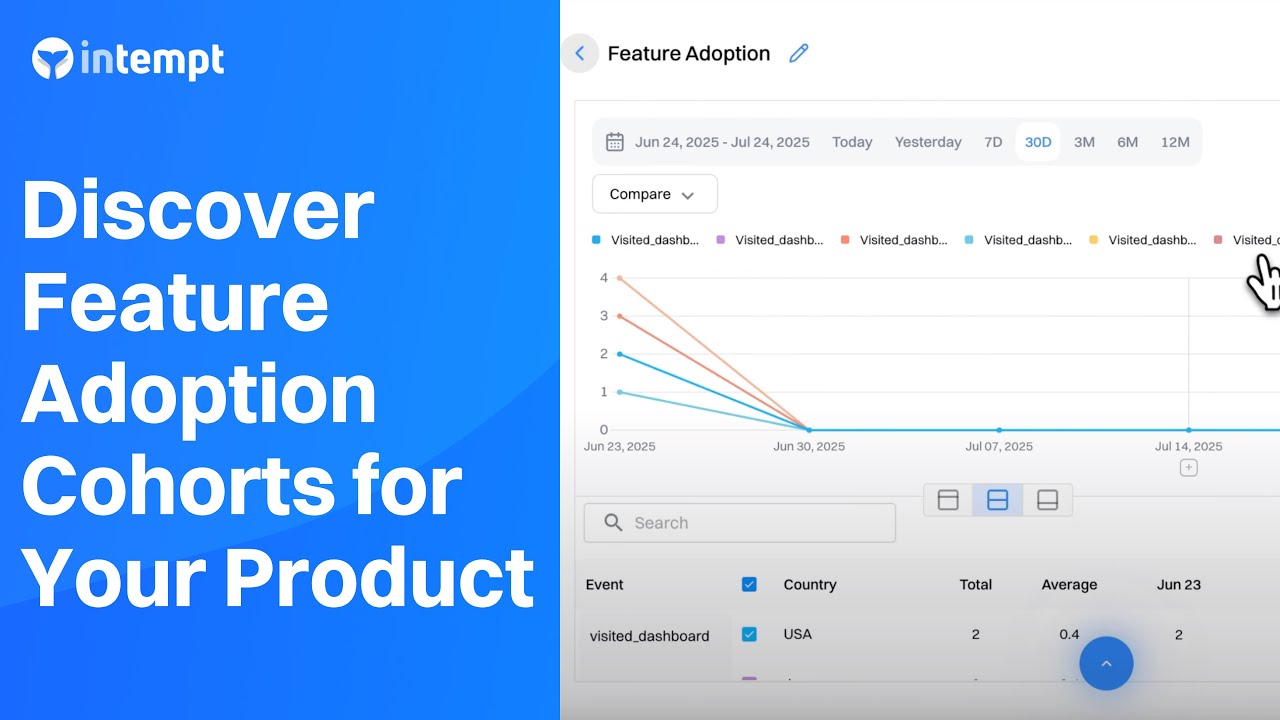
Build Insights for feature adoption and usage by cohort.
Build Funnels from signup → onboarding → activation → purchase.
Build Retention to spot stickiness and churn patterns.
Combine reports in a Dashboard with filters and breakdowns.
When you see a problem or opportunity, launch a Journey or an Experience.
Track impact in report trends and Journey/Experience analytics.
Result: Fewer reports, clearer decisions, faster product moves.
Intempt
Benefits
Clarity first. See who's using what, when, and where they fall off.
- From charts to changes. Move straight from a finding to a test.
- Shared context. Users roll up to Accounts, so product and go-to-market see the same story.
- Less tool juggling. Analysis, action, and measurement live together.
- Proof of impact. Tie changes to activation, retention, and revenue.
Intempt
How It Works
Trust the profiles first, keep a small set of core reports, put them on one dashboard, then attach a journey to whatever the dashboard surfaces.
Step 1: Anchor on Users and Accounts
Open a few real profiles. Confirm you can see key actions and useful attributes. This is your ground truth for "who did what."
Step 2: Build an Insights report in Analytics
Track which features are used, by whom, and when. Add simple breakdowns (plan, lifecycle stage, geography) to find patterns worth testing.
Step 3: Build a Funnels report in Analytics
Map the steps from signup to onboarding to activation to purchase. Compare drop-offs by device, plan, or campaign to find the highest-impact fix.
Step 4: Build a Retention report in Analytics
Measure how often people return. See which features correlate with coming back and which segments fall off.
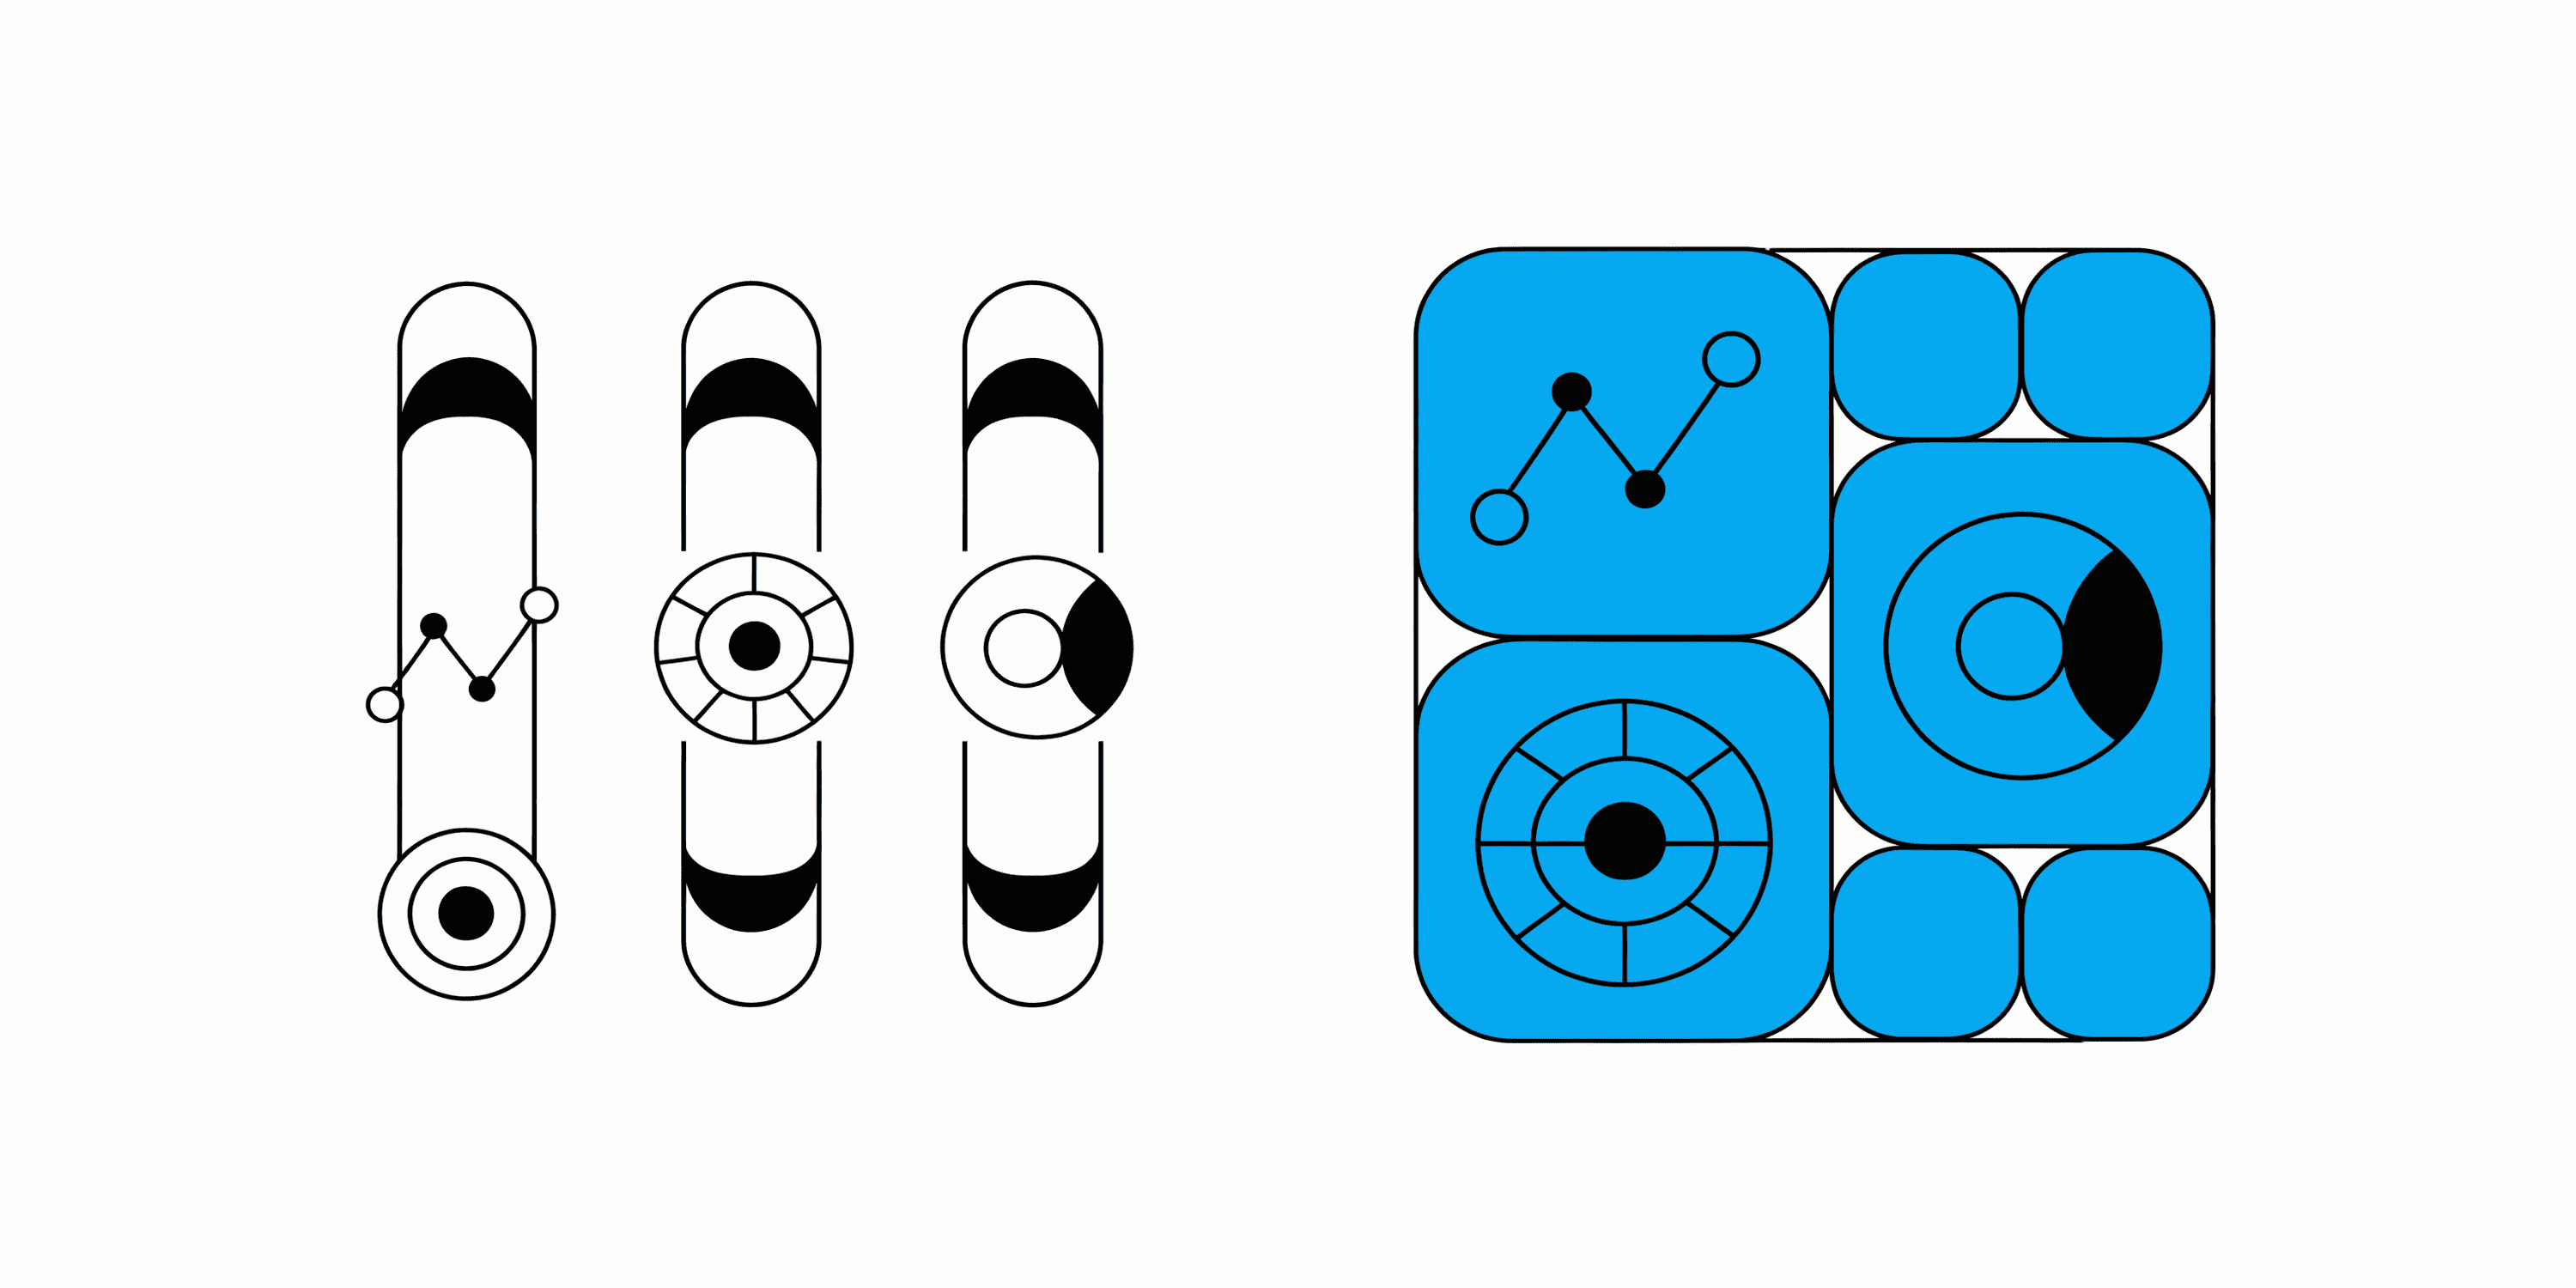
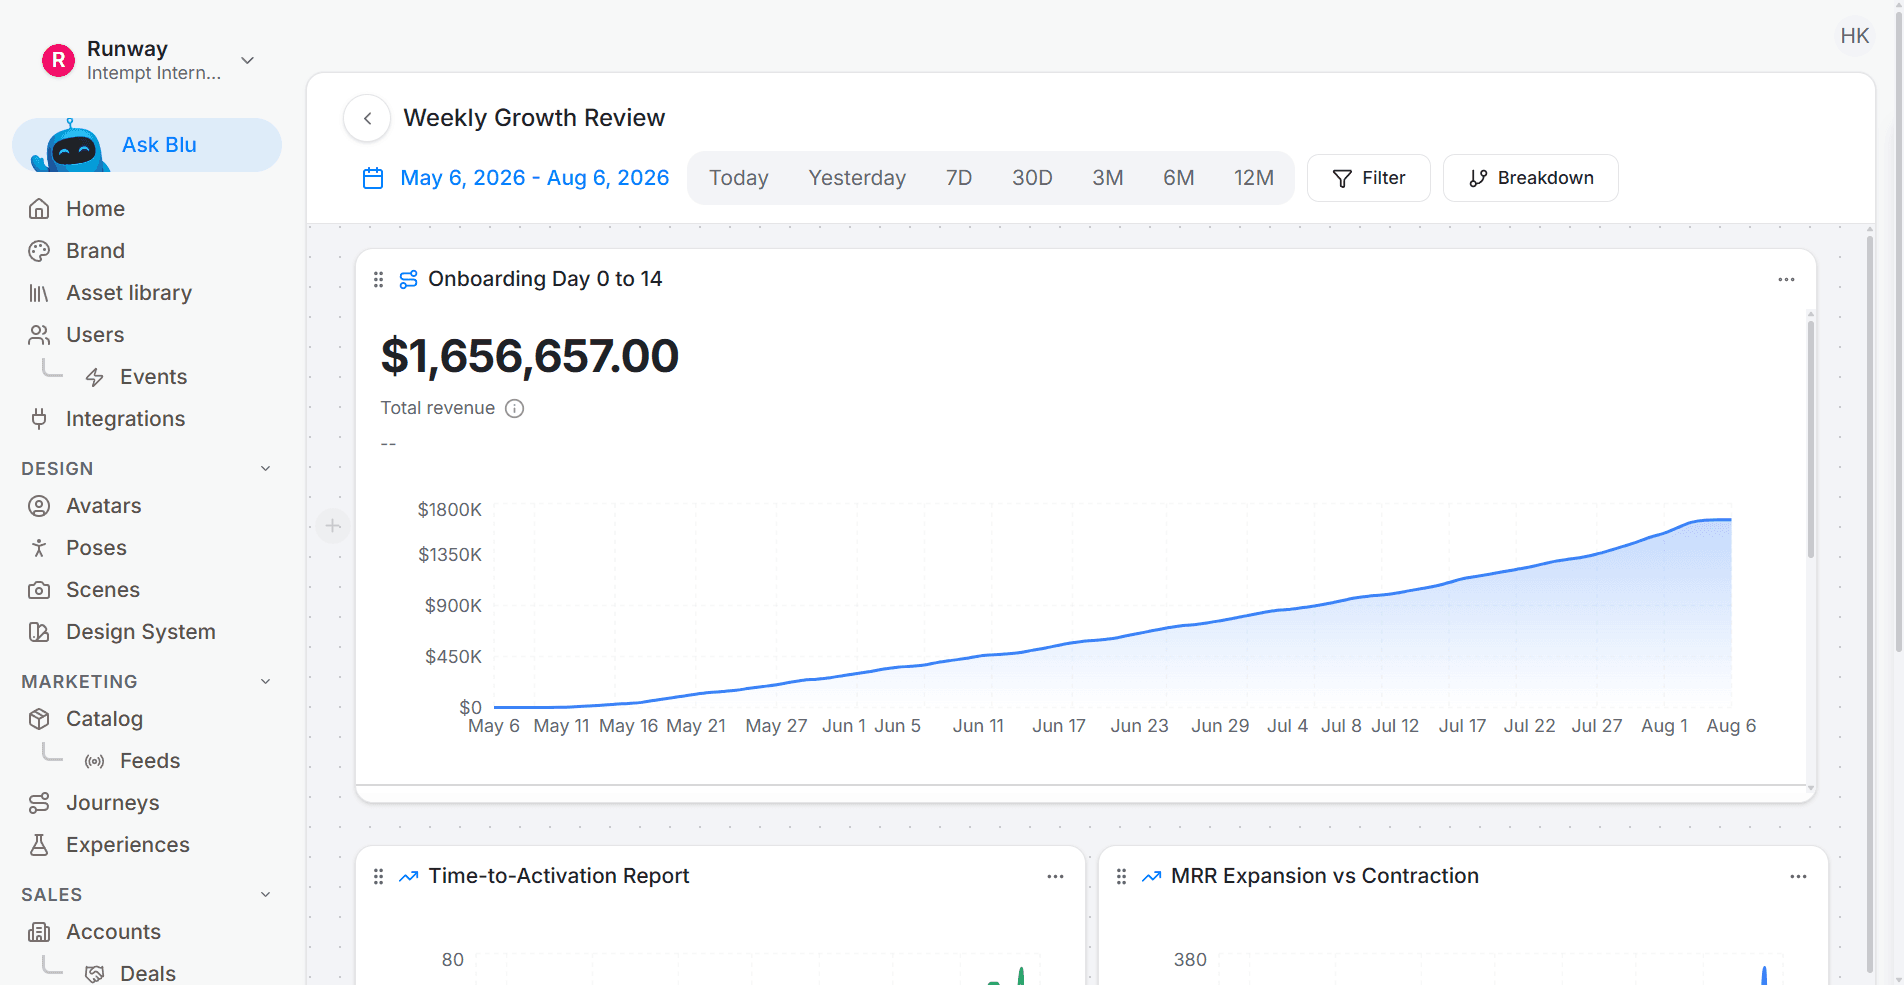
Step 5: Assemble a Dashboard
Pin the Insight, Funnel, and Retention reports. Add any Event, Segment, or Journey analytics you need. This becomes your weekly control room.
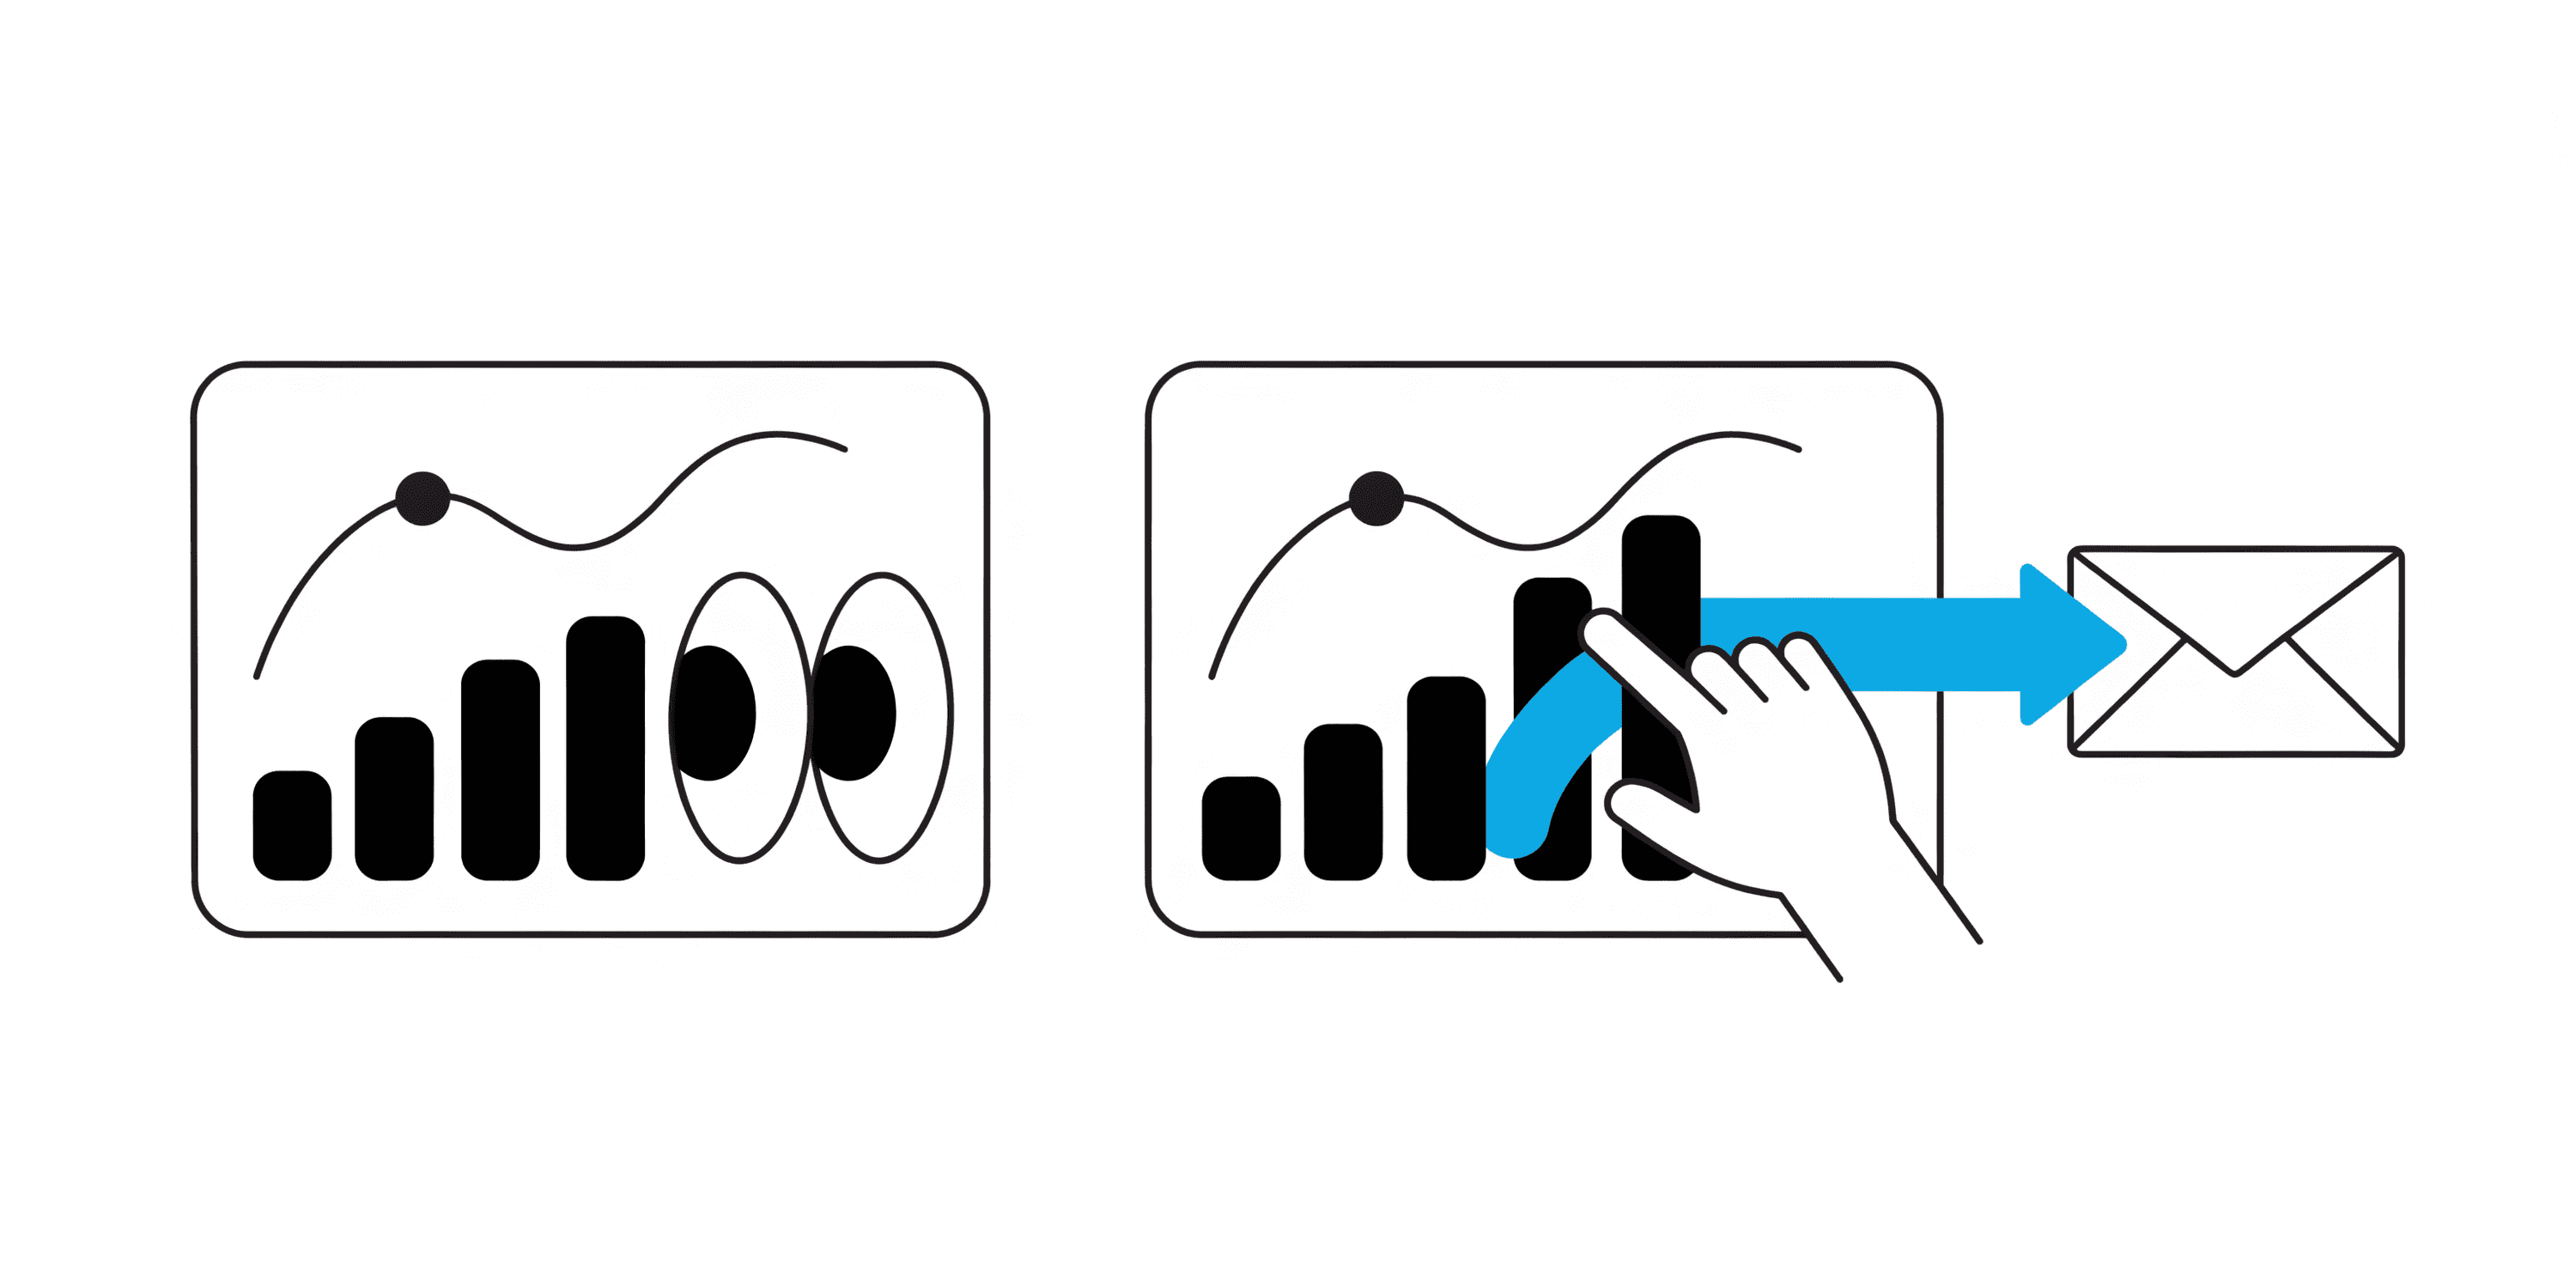
Step 6: Act and Measure
See a dip at a step?
Launch a small Journey or tweak an on-site Experience.
Watch the same reports for lift.
Keep what works, roll back what doesn't.
Good to Know
Keep event names simple and consistent; you don't need many, just the right ones.
Mark Goal Events (success) and Intent Events (early signals) so reports and targeting stay aligned.
Prefer recent windows over permanent flags; freshness beats static lists.
Start small: one feature, one funnel, one cohort, then expand when you see signal.
Close the loop
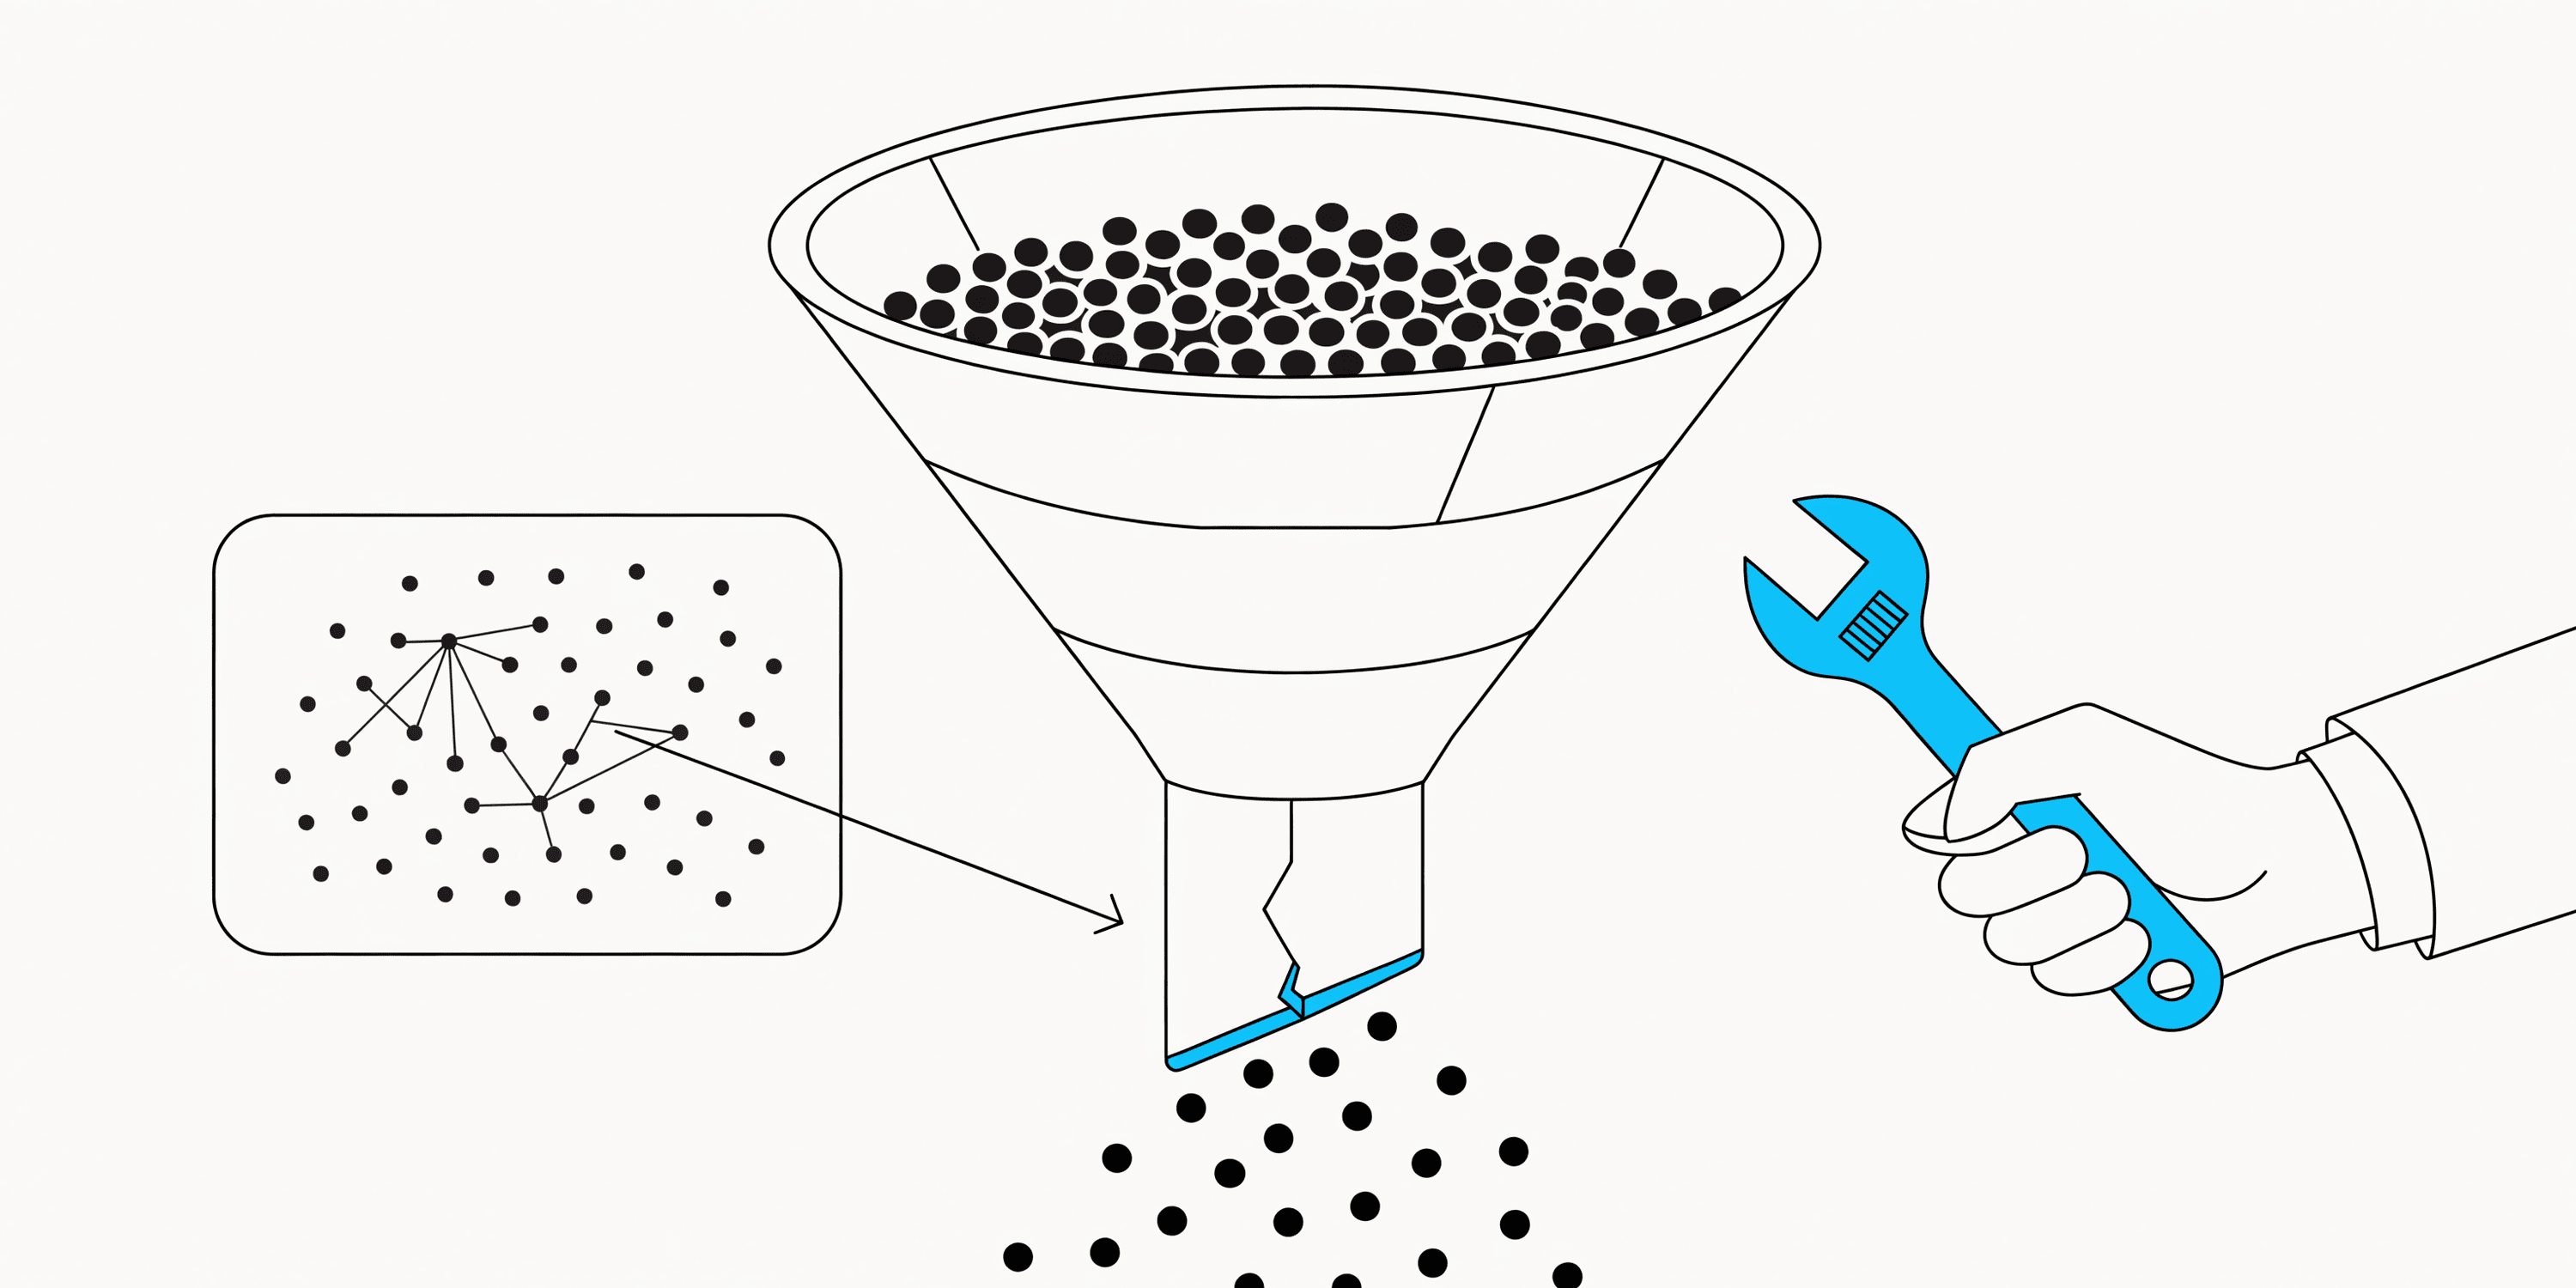
Report sprawl is a symptom. The cause is that finding something and acting on it happen in different tools, so the insight becomes a Slack message and then nothing.
Acting on a finding the same day requires the report and the journey to read the same profiles, which is what the agentic GTM platform provides. The weekly business review recipe collapses the reporting into one scorecard, which removes most of the sprawl.
Product analytics earns its keep when a finding turns into a journey the same day. Start with Intempt.
Frequently asked questions. Answered.
Users roll up to Accounts, so you can analyze individual behavior and see how it aggregates at the company level. This gives product and go-to-market teams the same story. You can drill into a specific user's actions or zoom out to see account-wide engagement patterns.