

- The best Claude skills for marketing analytics do the two jobs a BI seat cannot. They design the KPI and the alert threshold before the dashboard exists, and they turn a weekly export into a defensible read against your own history.
- This pack picks 9 free Claude Code skills for analysts, growth leads, and ops managers: KPI blueprint, anomaly alert, benchmark check, cohort tracker, leak finder, lever finder, weekly reporter, promo impact check, margin builder.
- Install the pack. Design the KPI before touching the dashboard.
Most marketing analytics dashboards fail in the same way. They report state - impressions, sessions, conversion rate, revenue - but they do not tell you whether the state is normal, what a red bar means for the business, or which lever to pull next. So they get glanced at on Monday morning, screenshotted into a Slack channel, and quietly stop being the input to any decision.
The gap is the reasoning layer. "Is this anomaly real" needs a method, not a chart. "Which cohort is retaining better" needs a table, not a screenshot. "What lever do we pull" needs a scored plan, not a slide. And building any of these by hand every week is a full-time analyst job that a startup or a lean growth team cannot always justify.
Claude Code skills fill that layer differently. A skill is a versioned SKILL.md file with a stated method - the inputs it asks for, the framework it applies, the output shape it returns. Same skill, same shape, every run. Which means the Tuesday KPI blueprint your analyst produces is the same shape as the Tuesday one the CEO reads, and the Friday anomaly alert is the same shape as the one that fired last week. This list is for whoever owns the marketing numbers: KPI definitions, anomaly calls, funnel reads and promo impact. If your week is spent in Shopify, ad-platform and returns exports chasing margin instead, the Claude skills roundup for ecommerce data analysts is the closer fit. Three skills appear on both lists.
What is a Claude Code skill
A Claude Code skill is a versioned SKILL.md file that Claude Code reads from a local .claude/skills/ folder. For analytics work, the inputs are usually a CSV or a saved-report export. The output is a structured read - the metric list plus its formulas, the anomaly verdict plus its method, the cohort table plus its cutoffs.
For the primitive-layer explainer, see the hub: Claude Code skills: what they are and which ones earn their install.
Why marketing analytics teams need Claude skills now
Two shifts have widened the gap between analytics tools and analytics decisions. First, the number of surfaces marketing runs on has multiplied - paid channels, organic, lifecycle, product-led, referrals - and each has its own reporting shape. Reconciling them into a coherent read is a full week per month. Second, the number of stakeholders who want an analytics read has grown - exec, CS, product, sales - and they all want it in a form they can trust.
The skills below answer three questions marketing analytics keeps re-asking:
- Is this metric normal, or has something actually changed - with a method we can point at?
- Which cohort or segment is the number hiding a problem inside of?
- For the change we saw, which lever caused it - and which lever should we bet on next?
Install the pack in about 30 seconds
The 9 skills below all live in the Data Analyst pack. One command installs them, then restart Claude Code.
npx skills add sidchaudhary/gtm-skills/skills/data-analyst

# Restart Claude Code, then confirm:
# "What analytics skills do you have available?"9 best Claude skills for marketing analytics
1. the-kpi-blueprint - one dashboard, one owner, one method per metric

Designs a KPI dashboard: the metric list with an explicit formula per metric, the visualisation form chosen from the question each answers, alert thresholds, and a layout wireframe. Meant for the team that keeps opening five tabs on Monday because nobody has ever written down the ten numbers that matter. The stated-formula-per-metric part is what stops the dashboard drifting - if the formula lives in the SKILL output, everyone can see and diff it.
When to use: Before you buy a BI seat, when an existing dashboard is not being read, or when a new stakeholder needs their own dashboard.
How to run:
You: "Run the-kpi-blueprint for our growth dashboard."
      [context: business model + audience + meeting frequency]

Claude: -> metric list with explicit formula per metric
        -> visualization form per metric (with reason)
        -> alert thresholds (with reason)
        -> layout wireframe (what goes above the fold)
-> the metrics we deliberately did NOT includeBest used with: A specific audience and a specific meeting cadence.
Where this skill hits its ceiling: It designs the dashboard; it does not build the SQL.
With Intempt: The blueprint plugs into Intempt Analytics so the metrics wire straight to the shared customer profile, and the alerts fire off the same events every campaign runs against.
2. the-anomaly-alert - is this real, or is it Tuesday

Takes a time series of one metric and flags which recent points are genuinely outside its normal range, using a stated trailing-average-and-deviation method rather than a gut read of a chart. The point of the stated method is that everyone can see the exact window and the deviation multiplier used, so the verdict is auditable.
When to use: When a metric moved and the team is arguing about whether it matters. Also as a scheduled check across a KPI list, so anomalies surface before the exec sees them.
How to run:
You: "Run the-anomaly-alert on our weekly conversion."
      [paste: metric time series, ideally 12+ weeks]

Claude: -> trailing baseline (window stated)
        -> deviation threshold (with reason)
        -> anomaly verdict per recent point
        -> the method restated inline (so it is auditable)
-> what would flip the verdictBest used with: A real time series, not a single week's number.
Where this skill hits its ceiling: It flags anomalies; it does not diagnose the cause.
With Intempt: Alerts fire against the shared analytics stream, so an anomaly in the campaign metric and one in the identity graph get compared to each other.
3. the-benchmark-check - is our number actually good

Takes one of your own metrics and checks it against a stated benchmark source, returning a clear over-or-under read and what the gap actually means. The discipline here is refusing to accept unsourced benchmarks. If the benchmark cannot be pointed at, the skill says so, rather than reproduce a number that has been screenshotted on LinkedIn 400 times.
When to use: When somebody says "we should be at 3 percent, industry benchmark" and nobody can name the industry study. Also before a fundraise where the pitch deck needs a defensible benchmark.
How to run:
You: "Run the-benchmark-check on our activation rate."
      [context: our number + segment + benchmark source claimed]

Claude: -> our number, restated with the definition
        -> the benchmark, with the source it comes from
        -> whether the benchmark's segment matches ours
        -> over / at / under verdict
-> what the gap actually means (before we conclude anything)Best used with: A named benchmark source.
Where this skill hits its ceiling: Benchmark quality. Comparing to a bad benchmark is worse than not comparing at all, and the skill will say so.
With Intempt: Benchmark reads attach to the KPI so the exec dashboard shows the comparison alongside the number, not in a separate slide.
4. the-cohort-tracker - the average is hiding something

Groups customers by acquisition period and tracks a retention or revenue metric across the periods that follow, returned as a cohort table. The value is telling you whether newer customers are performing better or worse than older ones - which the blended average deliberately hides. This is the skill that tells you whether the last three months of acquisition were good or bad, before revenue proves it.
When to use: When blended retention or revenue looks fine but the team suspects the trend is not. Also before a pricing change, to see whether the recent cohorts justify it.
How to run:
You: "Run the-cohort-tracker on our retention."
      [paste: customer table with acquisition date + activity]

Claude: -> cohort table (rows = period, cols = time since)
        -> the retention or revenue trend row-by-row
        -> whether newer cohorts are better or worse than older
        -> the caveat about cohort size
-> the segments this hidesBest used with: A real customer table with acquisition dates, not aggregate numbers.
Where this skill hits its ceiling: It builds the table. Diagnosing why a cohort is worse is a separate exercise.
With Intempt: Cohort reads run against the shared profile so lifetime, retention and referral all pivot off the same acquisition date.
5. the-leak-finder - which funnel step is losing people, and how badly

Takes your stage-by-stage funnel numbers and compares them against benchmarks to name where you are losing people relative to normal - not just where the biggest absolute drop is, which is usually the widest step. Each stage gets flagged green, yellow or red. This is the analytics skill that stops the pattern of redesigning the wrong page because the wrong number was the loudest.
When to use: Any time conversion is down and the team is not sure which surface caused it. Also as a scheduled check to see whether a change moved the leak or moved the number.
How to run:
You: "Run the-leak-finder on our funnel."
      [paste: stage-by-stage conversion from GA4]

Claude: -> each stage flagged green / yellow / red vs benchmark
        -> the diagnosis for red stages
        -> which auditor skill to run next
-> deliberately no fix suggestions before diagnosisBest used with: Real stage-by-stage numbers.
Where this skill hits its ceiling: Benchmarks are context-free.
With Intempt: The Analyze agent runs stage-by-stage diagnosis continuously so leak detection is a running signal, not a one-time paste.
6. the-lever-finder - the scored growth plan

Produces a prioritised growth plan: a maturity read, the candidate levers scored on effort, risk and reward, channel priorities, a 70-20-10 allocation, and an explicit statement of what is being declined for now. The "what we are declining" line is the whole point - teams usually fail at the priority call, not the execution.
When to use: Quarterly or annual planning, or when there are more good ideas than the team can run.
How to run:
You: "Run the-lever-finder for our growth plan."
      [context: current growth state + candidate levers + team capacity]

Claude: -> maturity read (where we are)
        -> candidate levers scored on effort/risk/reward
        -> channel priority
        -> 70-20-10 allocation with reason
-> what we are deliberately declining this quarterBest used with: Real numbers, not vibes.
Where this skill hits its ceiling: It picks the lever; it does not build the campaign.
With Intempt: Levers become tracked workstreams inside the Marketing agent so the 70-20-10 split shows up in the campaign calendar.
7. the-weekly-readout - one page, no dashboard tabs

Produces one weekly operating readout from exported performance, traffic, lifecycle, inventory and support summaries. Not scattered dashboards - one narrative document that names what changed, what likely caused it, and what to do next. Meant for the team that keeps meaning to write the weekly report and cannot find the time.
When to use: Every week. It is a scheduled skill, not a one-off. Also for post-mortem when a specific week needs a written record.
How to run:
You: "Run the-weekly-readout for last week."
      [paste: performance / traffic / lifecycle / inventory summaries]

Claude: -> what changed vs the prior week
        -> what likely caused the change (with the caveat)
        -> what to do next (ranked)
        -> the metrics that stayed flat (worth naming)
-> the open question we could NOT answer from this dataBest used with: Real exports, not screenshots.
Where this skill hits its ceiling: Summarizes across whatever data you provided. Missing data produces missing sections.
With Intempt: Weekly readouts attach to the workspace so the report is a queryable artifact, not a Google doc that ages out of the shared drive.
8. the-promo-impact-check - did the discount actually add profit
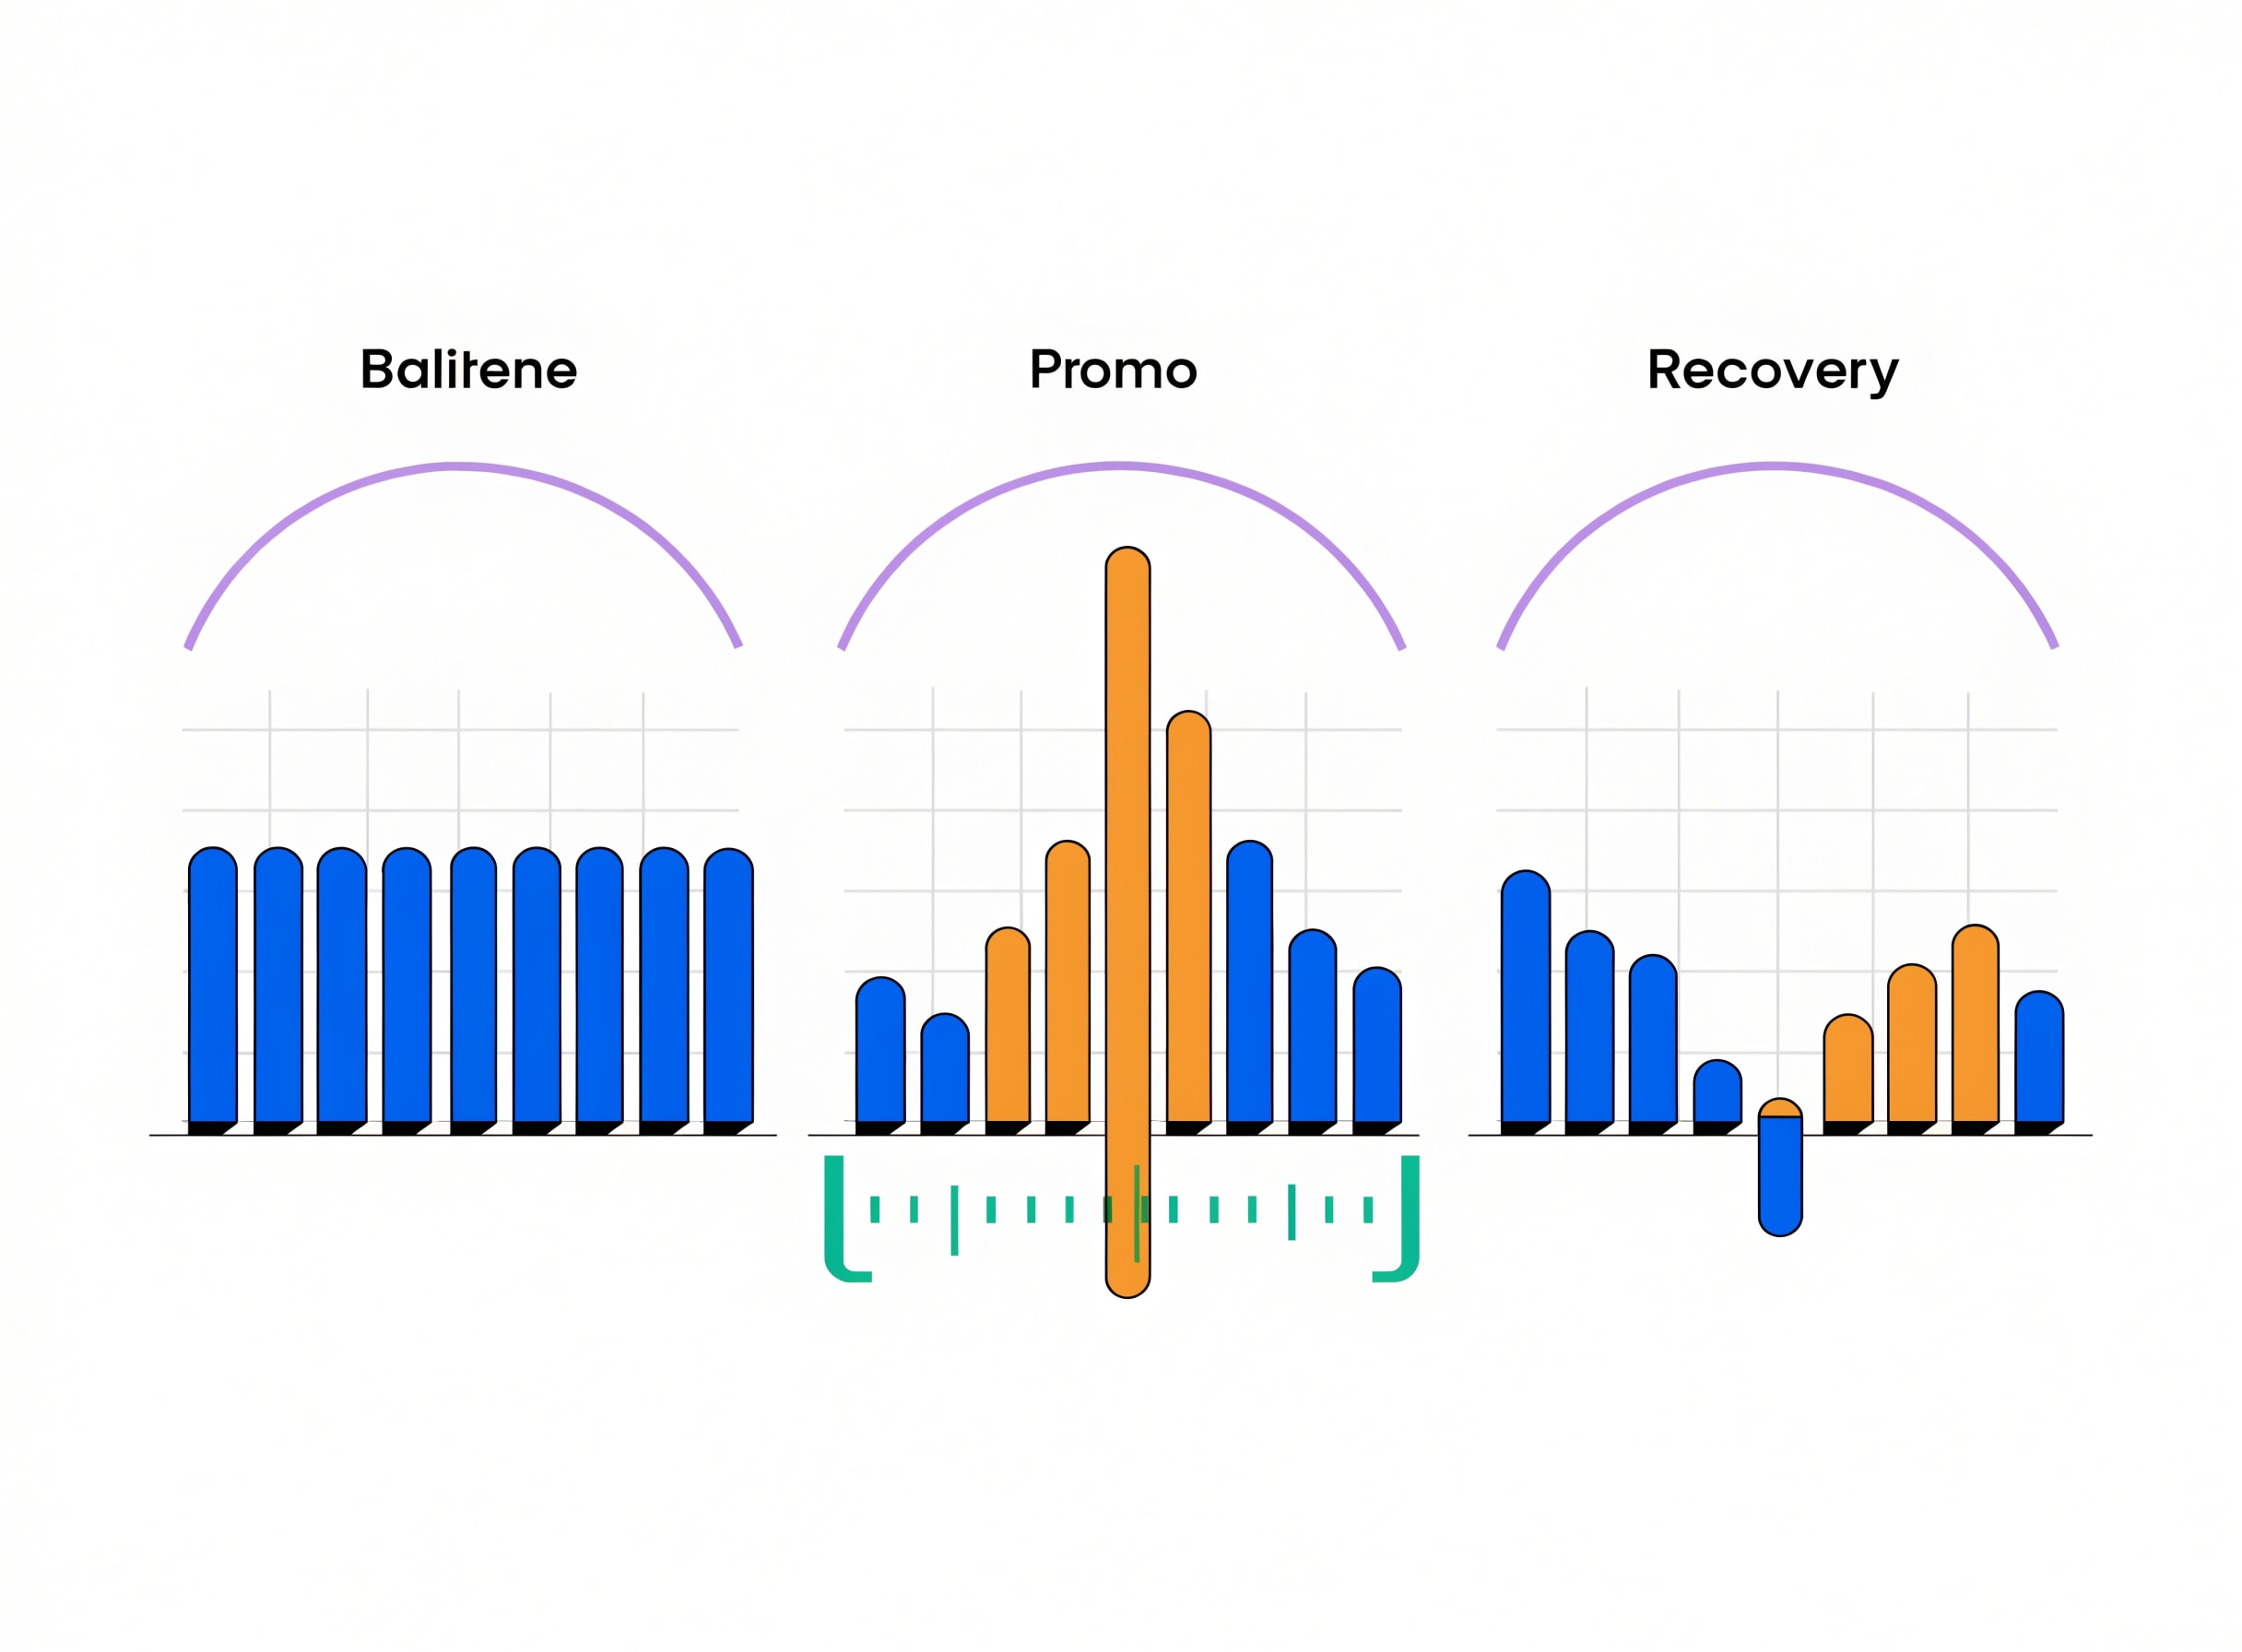
Builds a promotional campaign per channel from what's actually working in the market for similar products, and measures whether one that already ran added real profit or just pulled demand forward, using a stated baseline-versus-promo-versus-recovery window comparison. The value on the measurement side is the recovery window - most promo reads stop at the promo period, which is exactly when the pulled-forward demand shows up as a dip in the following week.
When to use: Designing a promo grounded in live market data, or after every promo, discount cycle or seasonal push, to see whether it actually paid off.
How to run:
You: "Run the-promo-impact-check on last month's promo."
      [context: baseline period + promo period + recovery period + margin]

Claude: -> baseline vs promo vs recovery (three windows)
        -> net profit impact (with margin, not just revenue)
        -> pulled-forward demand estimate
        -> the verdict (real lift vs demand pull)
-> whether to repeatBest used with: Real margin, not just revenue.
Where this skill hits its ceiling: Historical only. It does not predict a future promo's return.
With Intempt: Promo verdicts attach to the campaign so the retro is queryable.
9. the-margin-stack - which SKU or customer actually makes money

Builds a per-SKU or per-order contribution margin stack (CM1, CM2, CM3) from raw revenue, cost, fee, and ad-spend inputs, so you can see which products actually make money after every variable cost, not just after product cost. The pattern this catches: ROAS looks fine, profit does not - because ROAS is not profit, and only a real margin stack shows it.
When to use: Before scaling spend on a product, when profit and ROAS disagree, or when deciding which SKUs to drop.
How to run:
You: "Run the-margin-stack on our top 20 SKUs."
      [paste: revenue / COGS / fees / ad spend per SKU]

Claude: -> CM1 (after product cost)
        -> CM2 (after fees)
        -> CM3 (after ad spend)
        -> the SKUs unprofitable at CM3
-> the ones killed by ad spend vs already unprofitableBest used with: Real cost and fee data per SKU.
Where this skill hits its ceiling: Variable costs only. Fixed overhead is a separate exercise.
With Intempt: Margin reads attach to the SKU so the Sell workflows know which product is profitable to promote.
Which skill to run first, per analytics question
| The question | Run this first | Why |
|---|---|---|
| No dashboard has ever been designed | the-kpi-blueprint | Metric list with explicit formulas |
| A metric moved and we do not know if it is real | the-anomaly-alert | Trailing baseline + stated method |
| We keep hearing "industry benchmark" | the-benchmark-check | Refuses unsourced benchmarks |
| Blended average looks fine but trend feels off | the-cohort-tracker | The average hides the cohort |
| A funnel is bleeding, unclear where | the-leak-finder | Localize before you touch the surface |
| Planning next quarter's growth | the-lever-finder | Scored plan with a 70-20-10 allocation |
| Weekly report never gets written | the-weekly-readout | One narrative doc, not five dashboards |
| We ran a promo last month, did it work | the-promo-impact-check | Baseline vs promo vs recovery |
| ROAS is fine, profit is not | the-margin-stack | CM1/2/3 stack, not just revenue |
The pattern here: every skill states its method. That is what stops the recurring pattern of an analytics number moving without anybody being able to explain, three weeks later, exactly how it was computed.
Where Claude Code skills fit alongside Intempt
Skills produce reads, tables and blueprints. Intempt runs the identity graph and the live analytics stream every skill reads from. The handoff is: a skill drafts the KPI blueprint or the cohort table, you review it, it plugs into Intempt Analytics against the shared customer profile.
The reason this matters: analytics reads that live in exports rot. A cohort table built last quarter cannot see this quarter's customers unless someone reruns it. When the read plugs into the live profile, it updates as the underlying customer data does, and the reasoning layer stays current with the state layer.
What to install this week
- Install the data-analyst pack. All nine skills live there. A partial cross-pack install is not the right pattern here.
- Run the-kpi-blueprint first, once. The output is the input for every other skill in the pack.
- Schedule the-anomaly-alert and the-weekly-readout. Loops beat one-offs for analytics; the alert and the readout are the two you want running on a cadence.
- Save the outputs as files, not chat. A stored read is a diffable read.
Start for free on Intempt if you would rather run these reads against a live shared profile than a CSV pipeline.