Most teams shopping for an a/b testing tool ask the same question after a year of structured experiments: why is the win rate still stuck near 10%?
The instinct is to go looking for a better tool. A smarter visual editor, tighter statistical controls, slicker dashboards. That's the wrong diagnosis. The problem isn't the test. It's what happens after the test ends.
This is an honest a/b testing tools comparison: the structural difference between standalone testing tools and unified experimentation platforms, why that difference determines your win rate ceiling, and what to actually look for before signing anything.
The 10% Win Rate Problem No One Talks About
Here's the number that doesn't make it into vendor pitch decks: roughly 1 in 8 A/B tests produces a statistically significant positive result.
12.5%. That's the industry average for on-site conversions lifted by A/B testing. Most experiments produce noise.
A large-sample analysis of more than 1,001 A/B tests found that 36.3% of tests technically "win," but 22.1% produce a statistically significant loss, and 41.6% are completely inconclusive. The median Revenue per Visitor uplift from winning tests is just +2.77%. You're running a lot of tests for a thin, inconsistent payoff.
The standard response is to run more tests. Tighten your hypotheses. Add behavioral research before each experiment. And it helps a little. But win rates stay stubbornly low for most teams.
Here's the distinction that matters. Two different failure modes sit inside this 10% number, and they have different causes.
The first is statistical failure: tests that run too long, don't hit the sample size, or produce results too noisy to act on. This is a test infrastructure problem. Better statistical methods (more on this below) solve it.
The second is activation failure: tests that produce a valid winner but can't deliver that winner to customers before the segment shifts. This is a data architecture problem. Better statistical methods don't touch it.
Most teams focus on the first. Almost no one talks about the second. And the second is where the real revenue leak happens.
What's Actually Causing It: Disconnected Test Data?
Picture the typical experimentation workflow at a growth-stage ecommerce or SaaS company.
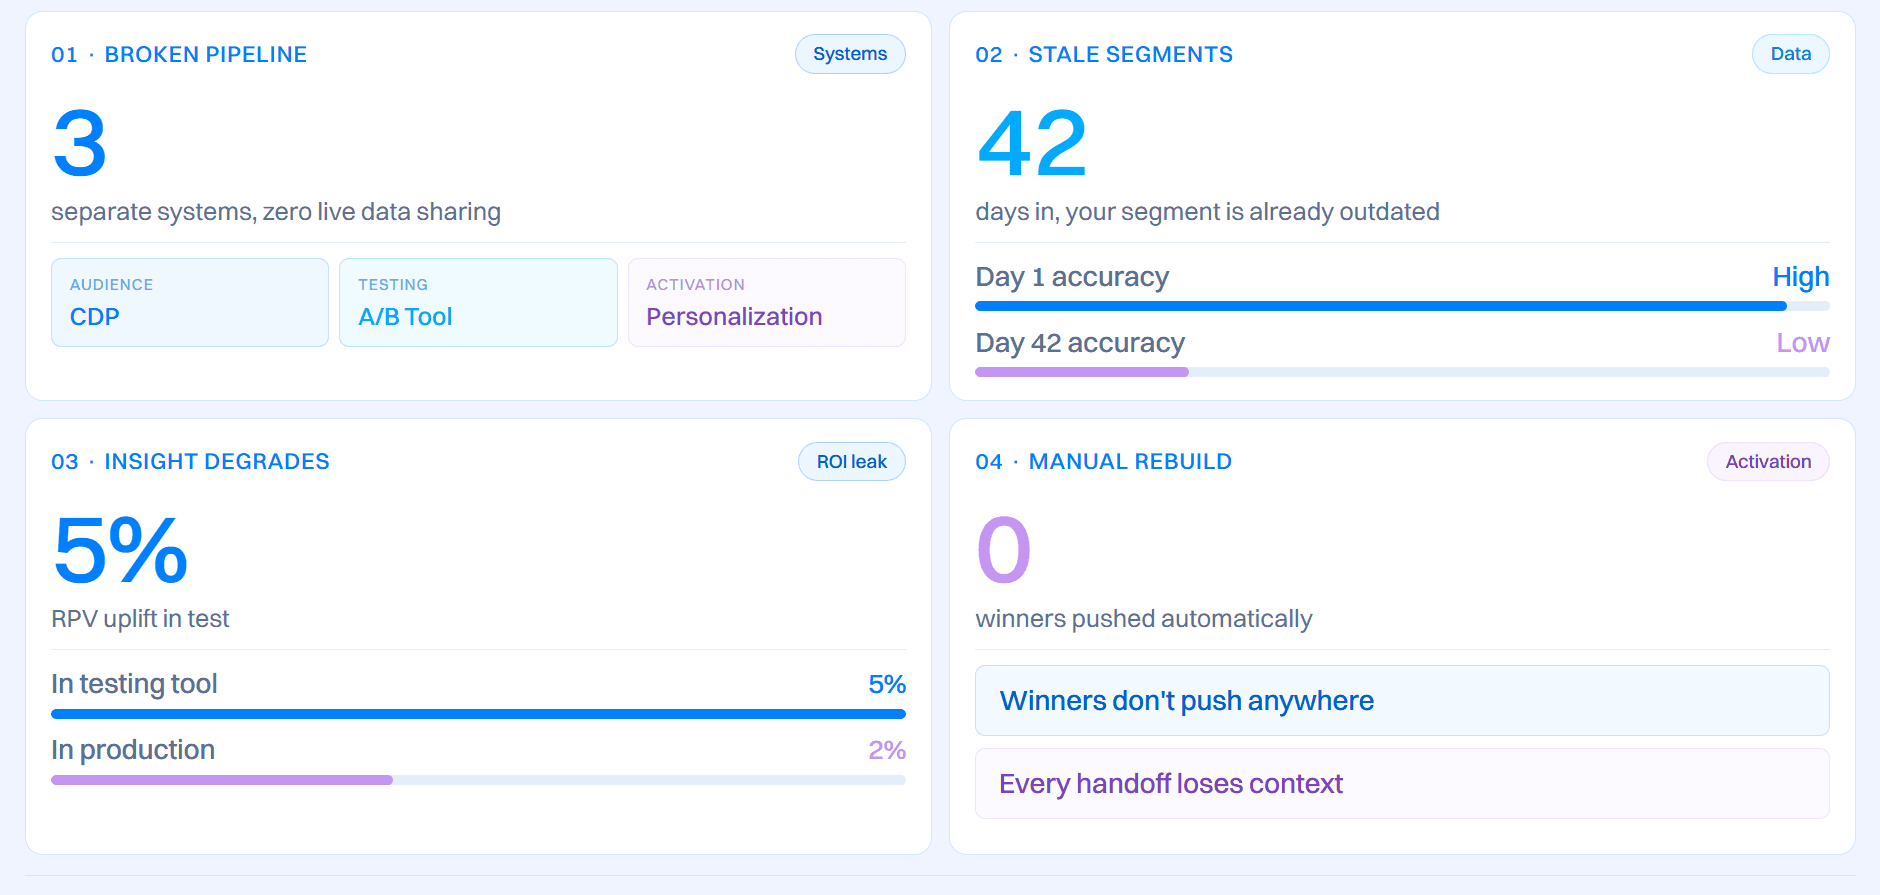
You build your segment in your CDP. Export it to your A/B testing tool. Define variants. Run the test for 42 days (the industry median runtime). Declare a winner. Screenshot the results. Export them. Paste into a slide deck. Schedule a meeting. Discuss implementation. Rebuild the winning variant in your personalization platform or email tool. Push to production.
By the time the winner reaches customers, the segment it was built for has moved.
Those "high-intent mobile visitors who added to cart twice without purchasing" are different people than they were six weeks ago. The behavioral window has closed. The personalization fires against a stale profile. And the downstream revenue impact looks weaker than the test predicted.
This is an activation failure in practice. The test was valid. The winner was real. But the data connecting the test to the customer had already drifted by the time anyone acted on it.
Every export is a place where segment drift happens. Every sync is a gap between insight and action. Statistical failure and activation failure compound each other: you're waiting weeks for a result, then spending more weeks implementing it in a separate system, against an audience that no longer looks the same.
Both problems have the same root: the tool that runs the test and the system that acts on the result are disconnected. Running a/b testing with a customer data platform that never shares a live data layer isn't an architecture problem you can export your way out of.
Why Standalone A/B Testing Tools Are Flawed?
Standalone A/B testing tools are built around a single job: present variants, measure performance, report results. They do that job well. The problem is the architecture underneath.
Every standalone tool assumes three separate workflows: audience data lives in your CDP, experiments run in your testing tool, and winning variants activate in your personalization platform or email tool. None of these systems shares a live data layer. Every handoff between them is a manual step, and every manual step is a place where the insight degrades.
The segment you imported on day one was accurate then. By day 42, it reflects who those customers were, not who they are now. When you rebuild the winning variant in a separate system, you're activating against a frozen snapshot. The 5% RPV uplift your test showed becomes 2% in production. Nobody knows exactly why. Everyone blames the hypothesis.
This isn't a bug in any individual tool. It's a design consequence of separating testing from activation. Here's what that looks like structurally across every standalone platform:
- Three separate systems, one broken pipeline. CDP owns your audience data. The A/B testing tool runs experiments. A personalization platform or email tool activates the winner. None shares a live data layer.
- Segments are snapshots, not feeds. The audience you import into your testing tool is frozen at the moment of export. By day 42 of your test, it reflects who those customers were, not who they are now.
- Winners require a manual rebuild. Declaring a winner in your testing tool doesn't push it anywhere. Someone has to take the result, redefine the segment in the activation system, and rebuild the experience from scratch.
- Every handoff degrades the insight. Each export, sync, or copy-paste step is a place where timing is lost, context is dropped, and the on-site conversions you measured in the test don't match what reaches production.
- The tool reports results. Someone else has to act on them. That gap is where experimentation ROI leaks.
Where the Top Standalone Tools Break Down?
The three platforms most teams are comparing right now all share this structural limitation.
1. Optimizely
Optimizely is the category leader in enterprise web experimentation. For large-scale testing programs with dedicated CRO teams, it's genuinely powerful. Warehouse-native analytics, AI-assisted variation creation, and a redesigned visual editor make it one of the most capable standalone testing tools available.
But here's what the workflow actually looks like when a test concludes. Your team runs a multivariate test on a product detail page across 500,000 monthly visitors. Optimizely handles it well. You get clean statistical output and a clear winner. That winner lives in Optimizely's reporting layer.
Your personalization team manually recreates it in your CMS. Your email team rebuilds the same logic for lifecycle campaigns. The segment that drove the result doesn't carry over. Someone redefines it in every downstream system from scratch.
That's not a workflow inconvenience. That's the structural source of activation failure. Optimizely was built to test, not to activate.
What you get:
A/B, multivariate, split URL, and multi-page testing. Warehouse-native analytics (GA 2025). Server-side a/b testing via a separate Feature Experimentation SKU. AI-assisted variation development.
Who it's built for:
Enterprise retail brands running 10+ simultaneous experiments across high-traffic pages (product listing pages, checkout, homepage), and enterprise SaaS teams testing feature adoption flows or pricing page variants at scale.
Works best when you have a dedicated CRO team managing experiments, a separate personalization team handling activation, and engineering resources to maintain the integrations between them. Realistic fit starts at 250,000+ monthly visitors and $36K+ annual budget.
What to watch for:
If you're testing a free shipping threshold message for a high-intent cart-abandonment segment and want the winning message to automatically update your email trigger for that same segment, Optimizely won't do that.
You'll declare the winner, then manually rebuild the logic in your email platform against a re-exported version of the original segment. By then, the segment has shifted. The more time-sensitive your use case, the more this gap costs you.
Pricing:
No public pricing; contact sales required. As of March 2026.
2. VWO
VWO is the most accessible all-in-one CRO suite at mid-market pricing. Testing, heatmaps, session recordings, and personalization in one platform is a genuine advantage over pure-play testing tools.
Here's where it works well. A mid-market ecommerce brand sees a high drop-off on a product page. VWO lets them watch session recordings, run a heatmap, and build an A/B test based on what they found, all inside the same platform. That diagnostic-to-test loop is faster than stitching three separate tools together.
The gap shows up after the test. VWO Testing, VWO Insights, and VWO Personalize are separate products that don't share a unified customer data layer. A winning variant doesn't automatically become a live personalization rule. The segment doesn't travel with the winner. Someone still has to manually carry it across.
One more mechanic worth knowing: VWO prices by Monthly Tracked Users (MTU). When your quota runs out, all active tests stop. As your traffic grows from optimization, your bill automatically increases. You get penalized for succeeding.
What you get:
A/B, split URL, multivariate, and multi-page testing. No-code visual editor. Heatmaps, session recordings, and funnel analysis. AI-powered predictive segmentation. Multi-armed bandit testing. Strong integrations with GA4, Shopify, Salesforce, and HubSpot.
Who it's built for:
E-commerce brands at $2M to $30M GMV that want to understand user behavior before testing it (heatmaps and recordings inform the hypothesis, then testing confirms it).
Also strong for growth-stage SaaS teams testing landing page copy, pricing page layouts, or onboarding step variants, where behavioral context helps explain why a test won or lost.
Works best for teams that run 2 to 5 tests per month and want one CRO vendor rather than separate testing and insights tools.
What to watch for:
If you're testing a multi-step checkout flow and want the winning variant to automatically update your cart abandonment email sequence for the same segment, VWO won't close that loop.
Testing and activation are still separate modules that require a manual handoff. Also, each module carries its own MTU pricing. A team using Testing, Insights, and Personalize together can quickly land at $1,500 to $2,500/month before hitting enterprise scale.
Advanced features, including multivariate testing and split URL tests, are gated to Pro and Enterprise tiers.
Pricing:
Growth plan starts at $198/month for testing only (billed annually). Full-suite stacks push significantly higher. As of March 2026.
3. Dynamic Yield
Dynamic Yield (owned by Mastercard) is built for AI-powered personalization at enterprise scale. The statistical rigor is enterprise-grade. But this is a personalization-first product, not an experimentation-first one.
Here's where it makes sense. A large retail brand wants to personalize its homepage in real time: high-LTV customers see a loyalty promotion, first-time visitors see a bestseller collection, and lapsed customers see a re-engagement offer, all adapting dynamically across web, mobile, and email simultaneously.
Dynamic Yield was built for exactly this. Experimentation is how you validate which personalization strategy is working, not the primary workflow.
For teams whose goal is structured A/B testing and then activation, it's an expensive way to get there. Tests inform the personalization engine, but the relationship between test data, customer profiles, and activation runs through Dynamic Yield's proprietary architecture. Your email platform, CRM, and analytics tools can't read from it without custom integration work.
What you get:
Client-side and server-side A/B testing, multivariate testing tools capabilities, and full-stack personalization. Real-time AI-powered personalization engine. Product recommendation engine with 35+ algorithm types. Experience APIs for headless architecture, and behavioral and affinity-based audience segmentation.
Who it's built for:
Enterprise retail brands ($500M+ revenue), testing product recommendation placement and homepage personalization across web and mobile simultaneously. Financial services companies personalize loan offer displays or account dashboard variants based on behavioral and credit profile segments.
QSR and hospitality brands running kiosk menu personalization alongside the web. In all cases, the team has dedicated CX engineering resources, a clean data layer, and personalization as the primary growth lever, not just an experiment output.
What to watch for:
If your use case is "run a checkout flow test, measure Revenue per Visitor, and roll the winner into our cart abandonment email for the same segment," Dynamic Yield can technically do parts of this, but it's not the workflow the platform is designed around.
Pricing:
All custom contracts. Contact sales. As of March 2026.
What a Unified Experimentation Platform Looks Like?
The alternative to a standalone testing tool isn't a better standalone testing tool. It's a unified experimentation platform: one where the segment, the test, and the winner all share the same live customer data. No exports. No syncs. No separate activation step.
Here's the structural difference. In a disconnected stack, your segment is a frozen snapshot. By the time you declare a winner, the audience it was built on has already shifted. In a connected system, the segment is live.
It updates in real time. When you declare a winner, it activates against the same profile on which the test was built. The segment hasn't drifted. Nothing needs to be rebuilt elsewhere.
This changes what testing means. In a standalone tool, a test ends with a report. In a connected platform, the winner flows directly into the next version of your journey, personalization rule, or lifecycle message, all on the same data layer.
That's the difference between a reporting layer and a true winner activation experimentation tool.
Here's what a unified experimentation platform does differently:
- Live segments, not frozen exports. Audiences update in real time from the same unified customer profile. The segment your test runs against on day one is still accurate on day 42.
- Same data powers tests and personalization. No separate import. No re-sync. The test and the activation layer share one source of truth.
- Winner activation in one step. When you declare a winner, it rolls directly into your journey, personalization campaign, or lifecycle message without rebuilding anything in a separate tool.
- A/B testing runs on your actual customer data. Behavioral data from Shopify, Stripe, and HubSpot feeds directly into experiment targeting. No middleware required.
- Conversions connect to downstream revenue. Native Shopify and Stripe integrations mean you measure Revenue per Visitor, not just clicks.
Intempt is the platform that demonstrates this architecture in practice.
Intempt
Intempt is a unified experimentation platform that combines CDP, analytics, A/B testing, personalization, and lifecycle messaging in one connected system, starting at $19/seat/month. It's built for SaaS and ecommerce teams that want to run a/b testing with their customer data platform natively, not as two separate tools that sync on a schedule.
Here's what the workflow looks like end-to-end. You build a segment in Intempt using live behavioral data from Shopify, Stripe, HubSpot, or your web and mobile events. That segment is native to the platform. It updates in real time as customer behavior changes.
You run web and mobile experiments against it using the same no-code editor or server-side API. When you declare a winner, you roll it out directly into your journey builder, personalization campaign, or lifecycle message in one step.
The segment the test was built on is the same segment the winner activates against. Nothing was exported. Nothing was re-synced. Nothing has drifted.
This is what connected experimentation looks like in practice. The test doesn't end when you declare a winner. It flows forward into the next stage of the customer relationship, carried by the same data layer that started it.
What you get:
- Unified customer profiles: CDP layer aggregates data from Shopify, Stripe, HubSpot, web, and mobile in real time. No SQL or ETL pipelines required.
- Client-side and server-side a/b testing: No-code visual editor for UI tests, server-side a/b testing platform capabilities for pricing logic, feature flags, and recommendation algorithms.
- CUPED variance reduction: Uses pre-experiment historical data to reach statistical significance faster with smaller sample sizes.
- Sequential testing (mSPRT): Continuous monitoring lets you safely stop tests the moment evidence is conclusive, without inflating false positive rates.
- Unified audience targeting: Segments built in the journey builder are the same segments used in experiments. No re-sync required.
- Winner activation without a separate rebuild: Winning variants roll directly into personalization and journey logic on the same data layer.
- Native revenue tracking: Measures actual Revenue per Visitor via Shopify and Stripe integrations, not just conversion rate.
Who should use it:
E-commerce brands at $1M to $50M GMV on Shopify or WooCommerce that want to test a checkout variant for returning mobile buyers and immediately roll the winner into their post-purchase email sequence for the same segment, without rebuilding anything.
SaaS companies at $1M to $20M ARR that want to test an onboarding tooltip versus a modal for trial users and have the winning experience automatically feed into their HubSpot activation workflow.
Also strong for teams currently paying separately for a CDP, an A/B testing tool, and a personalization platform, and want to consolidate without losing capability.
What to watch for:
Initial data mapping requires upfront effort. Teams need to define key events and attributes early to get full value from predictive segmentation and revenue tracking.
The server-side a/b testing platform capabilities and advanced personalization features have a learning curve. Not a fit if you need a self-serve lead database or deep enterprise data warehouse integration as a primary requirement.
Pricing:
Free plan available (1 experiment, up to 100K events). Professional plan at $24/seat/month ($19.20 annual) with full access to all features. Enterprise plan at $99/seat/month ($79.20 annual). As of April 2026.
A/B Testing Tools Comparison: Standalone Tool vs. Unified Experimentation Platform
| Tool | Best For | Starting Price | Key Strength | Main Limitation |
|---|---|---|---|---|
| Intempt | E-commerce and SaaS teams wanting CDP + testing + activation in one connected stack | $19/seat/month | Unified data layer: test and activate against the same customer profile without exports | Learning curve for advanced server-side personalization; no built-in lead database |
| VWO | Mid-market CRO teams wanting testing + heatmaps + session recordings bundled | $198/month (testing only) | All-in-one CRO suite with behavioral insights alongside testing | Modules priced separately; MTU success tax increases cost as traffic grows; tests stop when quota runs out |
| Optimizely | Enterprise brands with 250K+ monthly visitors and dedicated CRO teams | Contact sales | Deep enterprise testing infrastructure, warehouse-native analytics, AI-assisted variation creation | Extremely high cost floor; activation requires a separate rebuild in your personalization or email tool |
| Dynamic Yield | Enterprise personalization-first teams with multi-channel operations | Contact sales | Enterprise-grade AI personalization across web, mobile, email, and kiosk | Experimentation is secondary to personalization; no self-serve trial; complex implementation required |
Here's the sharper workflow breakdown:
| Capability | Optimizely / VWO / Dynamic Yield | Intempt |
|---|---|---|
| Data freshness at activation | Stale (days to weeks via export or sync) | Real-time (same data layer) |
| Winner activation time | Days to weeks (manual rebuild required) | Immediate (direct rollout) |
| Statistical method | Standard frequentist (most) | CUPED + mSPRT sequential testing |
| Segment drift risk | High (segment built in a separate system) | None (unified customer profile) |
| Tool count required | 3 to 5 minimum (CDP + testing + personalization + analytics + email) | 1 |
What Better Experimentation Actually Looks Like?
The statistical case for connected experimentation isn't a theoretical one.
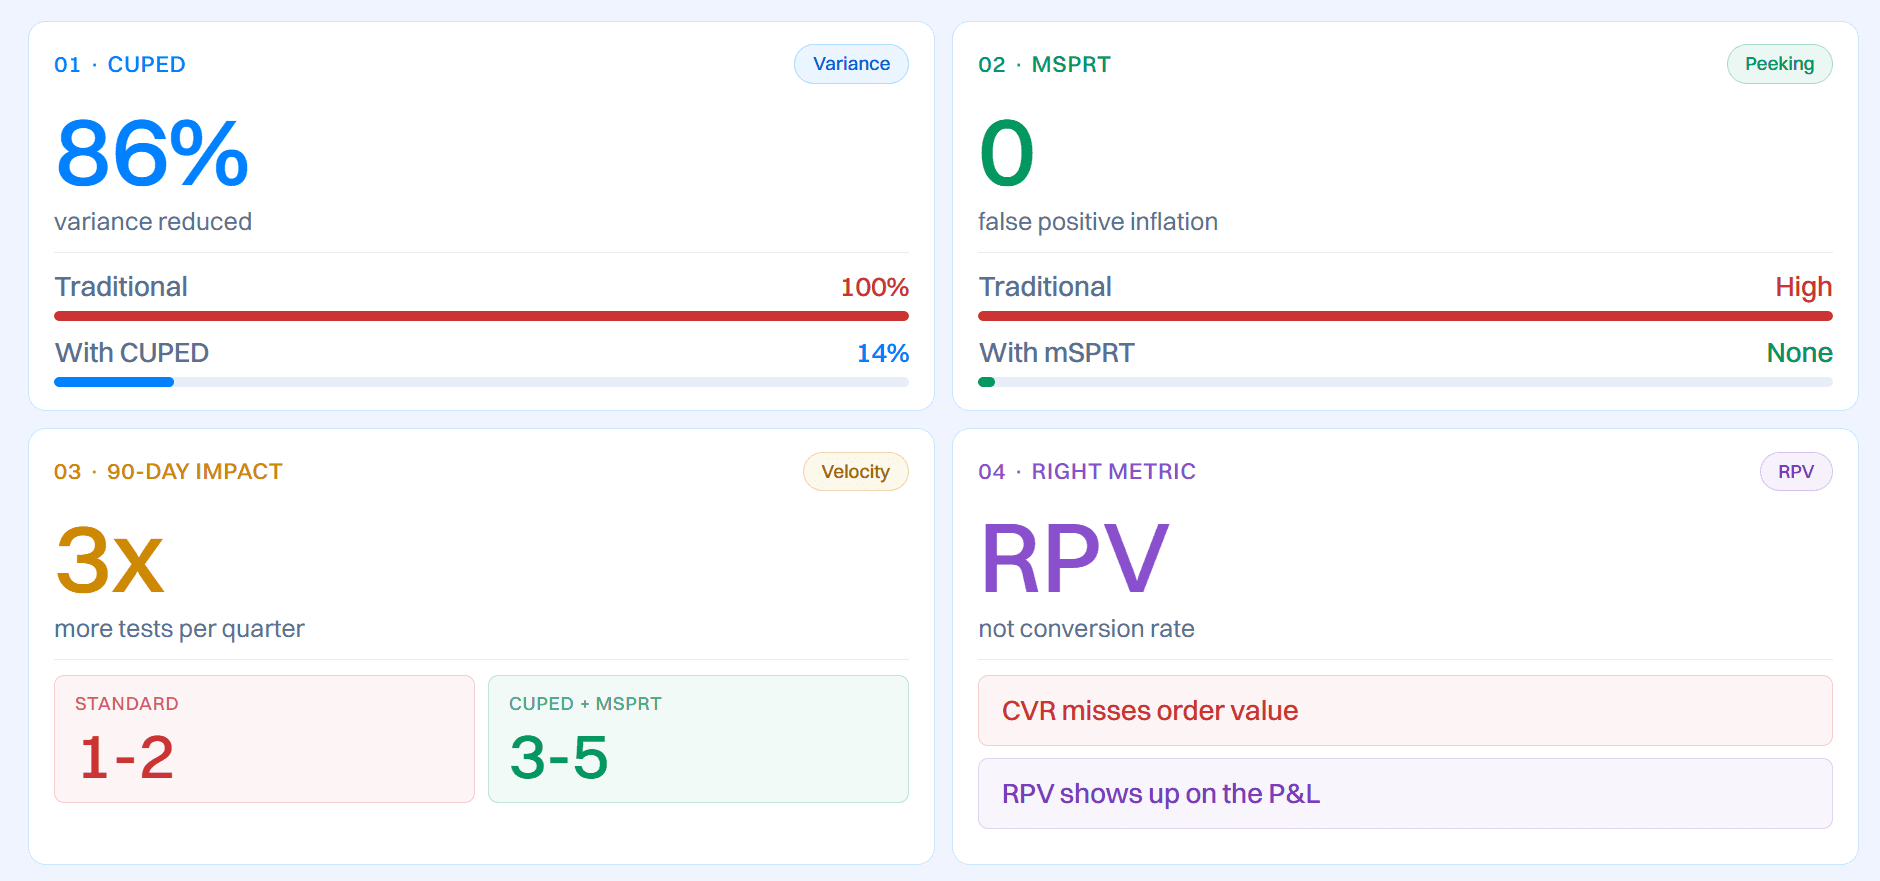
1. CUPED: Up to 86% variance reduction
CUPED variance reduction is documented at up to an 86% improvement in some implementations (variance reduced to 14% of baseline). The practical effect: you can run a statistically valid test at roughly half the sample size of a traditional fixed-horizon approach. For a mid-market ecommerce brand doing 50,000 monthly visitors, that's the difference between a test taking five weeks and taking two and a half.
2. mSPRT: No more peeking problem
mSPRT eliminates the peeking problem. Traditional testing inflates false positive rates when you check results before reaching your pre-set sample size. mSPRT is designed for continuous monitoring, so you can act on results as soon as evidence is conclusive without invalidating the test. The result: reliable tests that close when they're done, not when an arbitrary timer runs out.
3. What this means for a 90-day program
A team using standard fixed-horizon methods with a 42-day median test duration can reliably complete one to two tests per quarter. A team using CUPED and mSPRT, with tests completing in two to three weeks, runs three to five. That's three to five data-backed improvements shipped per quarter versus one to two.
4. Track Revenue per Visitor, not conversion rate
The right metric for e-commerce experiments is Revenue per Visitor. RPV captures order value, repeat purchase behavior, and downstream effects that conversion rate misses. A conversion rate win that reduces average order value isn't a win.
Real Example: FieldsUSA, an outdoor adventure ecommerce brand, is a direct example. They shifted experimentation reporting from conversion rate to RPV as the primary success metric.
Tests that looked like wins on conversion rate were producing flat or negative revenue outcomes because of order value effects that conversion rate doesn't capture.
Measuring the right number changed which experiments got shipped and which got discarded. RPV is the metric that shows up on the P&L. It should be the metric your testing tool reports against.
How to Evaluate Your Next A/B Testing Tool?
Use these before you sign anything. Standalone tools fail most of them. Connected platforms pass them.
| # | Evaluation Question | What to Look For | Red Flag |
|---|---|---|---|
| 1 | Where does your test segment live after the test ends? | Segment, test, and activation all share one unified data layer | Manual re-sync between CDP and the A/B tool, leading to segment drift |
| 2 | How does a winning variant get into production? | One-step activation directly from the test using the same live customer profile | Exporting results and manually rebuilding variants in other tools |
| 3 | What statistical methods are available? | Support for CUPED variance reduction and mSPRT sequential testing | Only fixed-horizon testing with no advanced statistical methods |
| 4 | What is the true all-in cost? | Clear total cost including integrations, maintenance, and engineering effort | Evaluating based only on the subscription price of a standalone tool |
| 5 | What is the metric of record for a "win"? | Tracks Revenue per Visitor and connects to downstream revenue data | Focus only on the conversion rate without revenue impact visibility |
How To Choose The Most Suitable Tool?
| Platform | Choose If | Example Use Case |
|---|---|---|
| Intempt | You're a Shopify ecommerce brand or SaaS company ($1M–$50M ARR) and need winning variants to instantly update journeys, emails, or personalization for the same segment | Test two checkout layouts for returning mobile buyers and push the winner live into your cart abandonment flow the same day. Or send a winning trial upgrade message directly into your HubSpot workflow |
| VWO | You want to understand user behavior before testing and do both in one tool | Use session recordings and heatmaps to analyze drop-offs on a pricing page, then build and run an A/B test based on those insights |
| Optimizely | You run a large-scale enterprise experimentation program with many concurrent tests and dedicated teams | Run multivariate tests across product, category, and checkout pages for millions of users, with analytics feeding into a BI system |
| Dynamic Yield | Personalization is your main strategy, with A/B testing used to validate it | Run AI-driven personalization for multiple customer segments across web, mobile, and email, testing algorithm performance |
Bottom Line
If you've been evaluating your a/b testing tool and your win rate or revenue impact from experiments isn't moving, the problem is almost certainly in the activation gap. Standalone testing tools were designed to run experiments and surface results.
What happens between "winner declared" and "customers see the change" is where value leaks. Statistical improvements solve test speed. They don't fix segment drift or manual activation delays.
For most e-commerce and SaaS teams at the growth stage, the tradeoff looks like this. Optimizely and Dynamic Yield are well-architected for enterprise programs with dedicated teams and engineering resources.
VWO is genuinely solid at mid-market scale, but module-based pricing and the MTU model mean costs grow as you succeed. A platform where the segment, the test, and the winner share a single data layer changes the ROI math on experimentation entirely, and that difference shows up in whether your winning experiments actually produce revenue or just reports.
The next move: take the five evaluation questions above into your next vendor demo. Ask for a live walkthrough of how a winning variant goes from declared to live in production. That answer will tell you more than any feature comparison slide.
TL;DR
- Every a/b testing tools comparison focuses on features. The right question is: what happens after you declare a winner?
- Two separate failure modes sit inside low experimentation ROI: statistical failure (test never reaches significance) and activation failure (winner never reaches customers before the segment shifts). Both stem from disconnected data but need different fixes.
- Intempt ($19/seat/month): segment, test, and activation share one data layer. Replaces CDP + testing + personalization + email in one connected stack.
- VWO ($198/month for testing): best mid-market CRO suite with heatmaps and session recordings bundled, but modules are separate SKUs and the MTU success tax scales with your traffic.
- Optimizely: enterprise-grade testing infrastructure with warehouse-native analytics, but activation still requires a manual rebuild in a separate tool.
- Dynamic Yield: enterprise AI personalization leader, but experimentation is a secondary feature and there is no self-serve trial.
- CUPED + mSPRT can reduce test runtimes from 42+ days to two to three weeks, enabling 3 to 5 reliable experiments per 90-day period. These methods deliver full value only when the winner activates against the same live data on which the test was built.
- Revenue per Visitor (RPV) is the right success metric for e-commerce experiments. If your tool only tracks conversion rate, you're missing order value and repeat purchase effects.
Frequently asked questions. Answered.
The best A/B testing tool for e-commerce is one that connects test results directly to customer profiles and journeys, not just a standalone variant tester. Platforms like Intempt run experiments on the same unified data that powers personalization and lifecycle messaging, so winning variants activate immediately without exports or re-syncing. Standalone tools like VWO and Optimizely are strong for testing but require a separate system to act on results. Intempt's free [A/B Test Calculator](/free-tools/ab-test-calculator) checks your sample size and significance regardless of which platform you land on.