Repeat purchase rate measures the percentage of customers who buy from you more than once. Industry averages range from 10% for luxury goods to 60%+ for subscription ecommerce. Brands with strong repeat purchase rates see higher lifetime value, lower effective acquisition costs, and more predictable revenue growth. This guide covers the formula, category benchmarks, the most common reasons RPR underperforms, and 12 proven strategies to increase it.
Repeat purchase rate is the percentage of customers who buy from you more than once within a defined period - calculated as (Repeat Customers ÷ Total Customers) × 100. Industry averages range from 10–15% for luxury goods to 50%+ for subscription ecommerce. A Harvard Business Review and Bain analysis found that a 5% improvement in retention can boost profits 25 to 95%. This guide covers the formula, category benchmarks, the 12 highest-impact strategies to increase it, and the metrics that explain why it underperforms.
Acquiring new customers has never been more expensive. Rising ad costs, platform competition, and shrinking attention spans have pushed customer acquisition costs up across every ecommerce category. The brands building durable businesses are not just acquiring customers - they are keeping them.
Repeat purchase rate is the metric that tells you how well you are doing this. It is a direct measure of customer loyalty, the health of your post-purchase experience, and the sustainability of your revenue model.
What is repeat purchase rate?
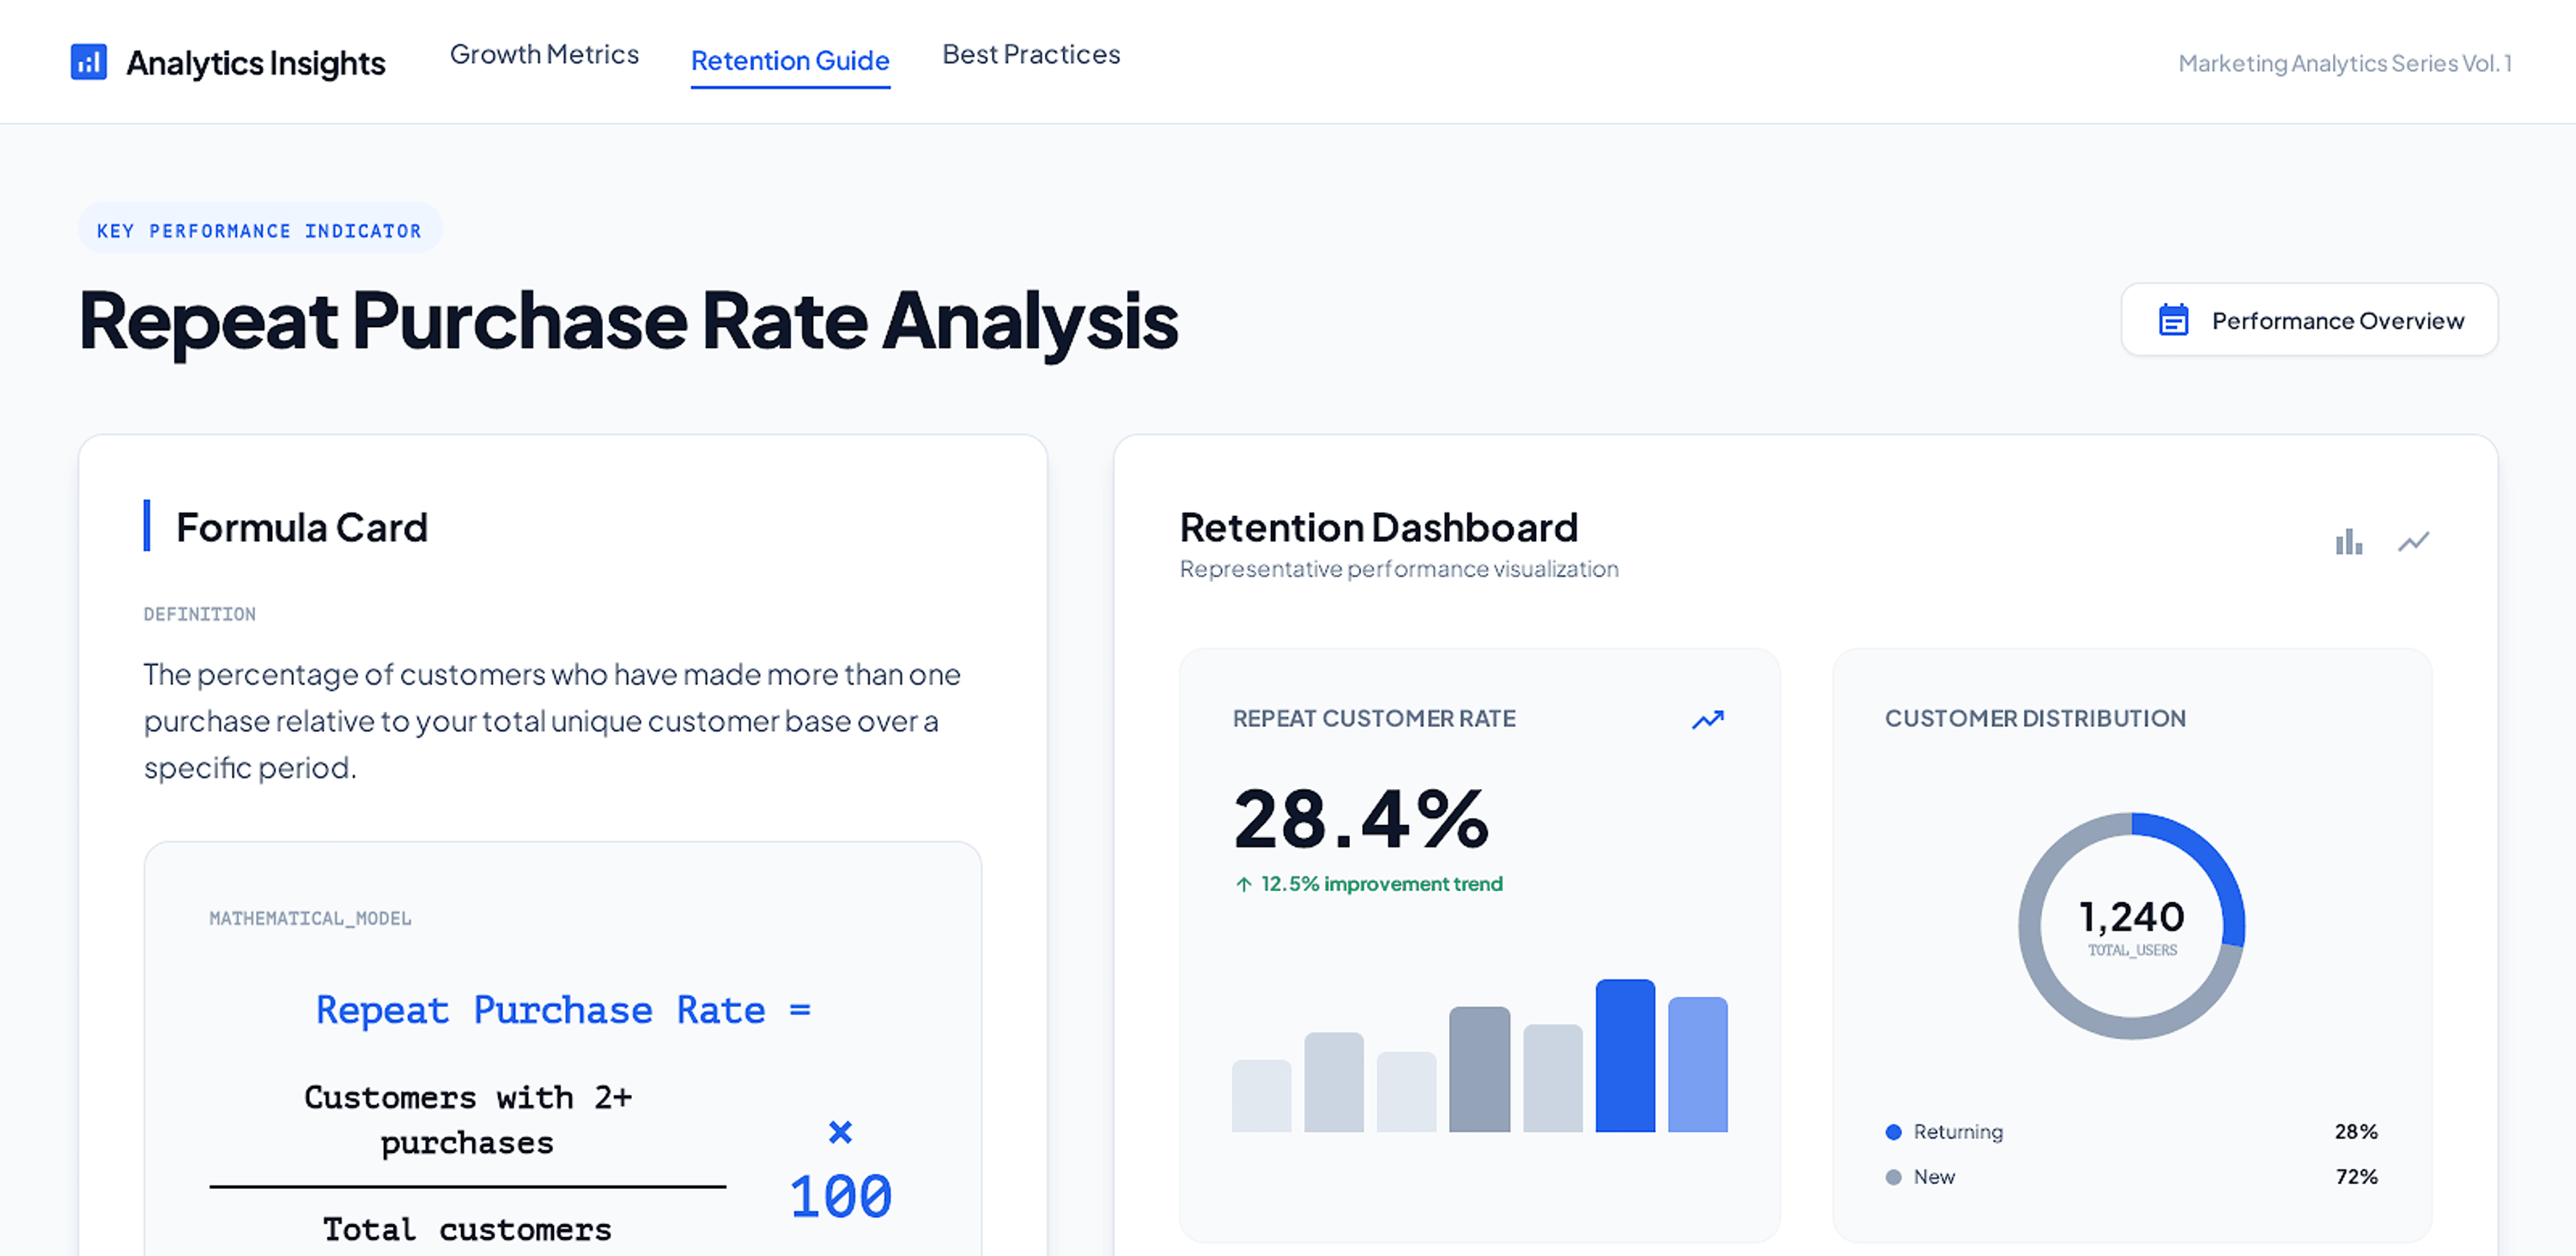
Repeat purchase rate is the percentage of customers who make more than one purchase from your store within a defined time period. It is one of the most direct indicators of customer loyalty and retention performance available to ecommerce brands.
A customer who buys once is a transaction. A customer who buys twice is beginning a relationship. Repeat purchase rate tells you how often that second purchase happens across your entire customer base.
One-time buyers and repeat customers behave very differently. A first-time buyer has roughly a 27% probability of returning. A customer who makes a second purchase has a 54% probability of making a third. The second purchase is the inflection point where a customer starts to become a loyal one.
- What it measures: the share of customers who came back to buy at least one more time
- Standard time window: 12 months, though monthly and quarterly tracking is also useful
- What it reveals: product quality, post-purchase experience, and the effectiveness of your retention strategy
- What it does not measure: how often customers buy or how much they spend, which are separate metrics called purchase frequency and average order value
Why does repeat purchase rate matter for ecommerce brands?
Customer acquisition costs keep rising
Paid acquisition has become more competitive and more expensive every year. iOS privacy changes, cookie deprecation, and ad platform saturation have pushed CPCs and CPAs up across Meta, Google, and TikTok. Brands that built their growth model entirely on paid acquisition are feeling this most acutely.
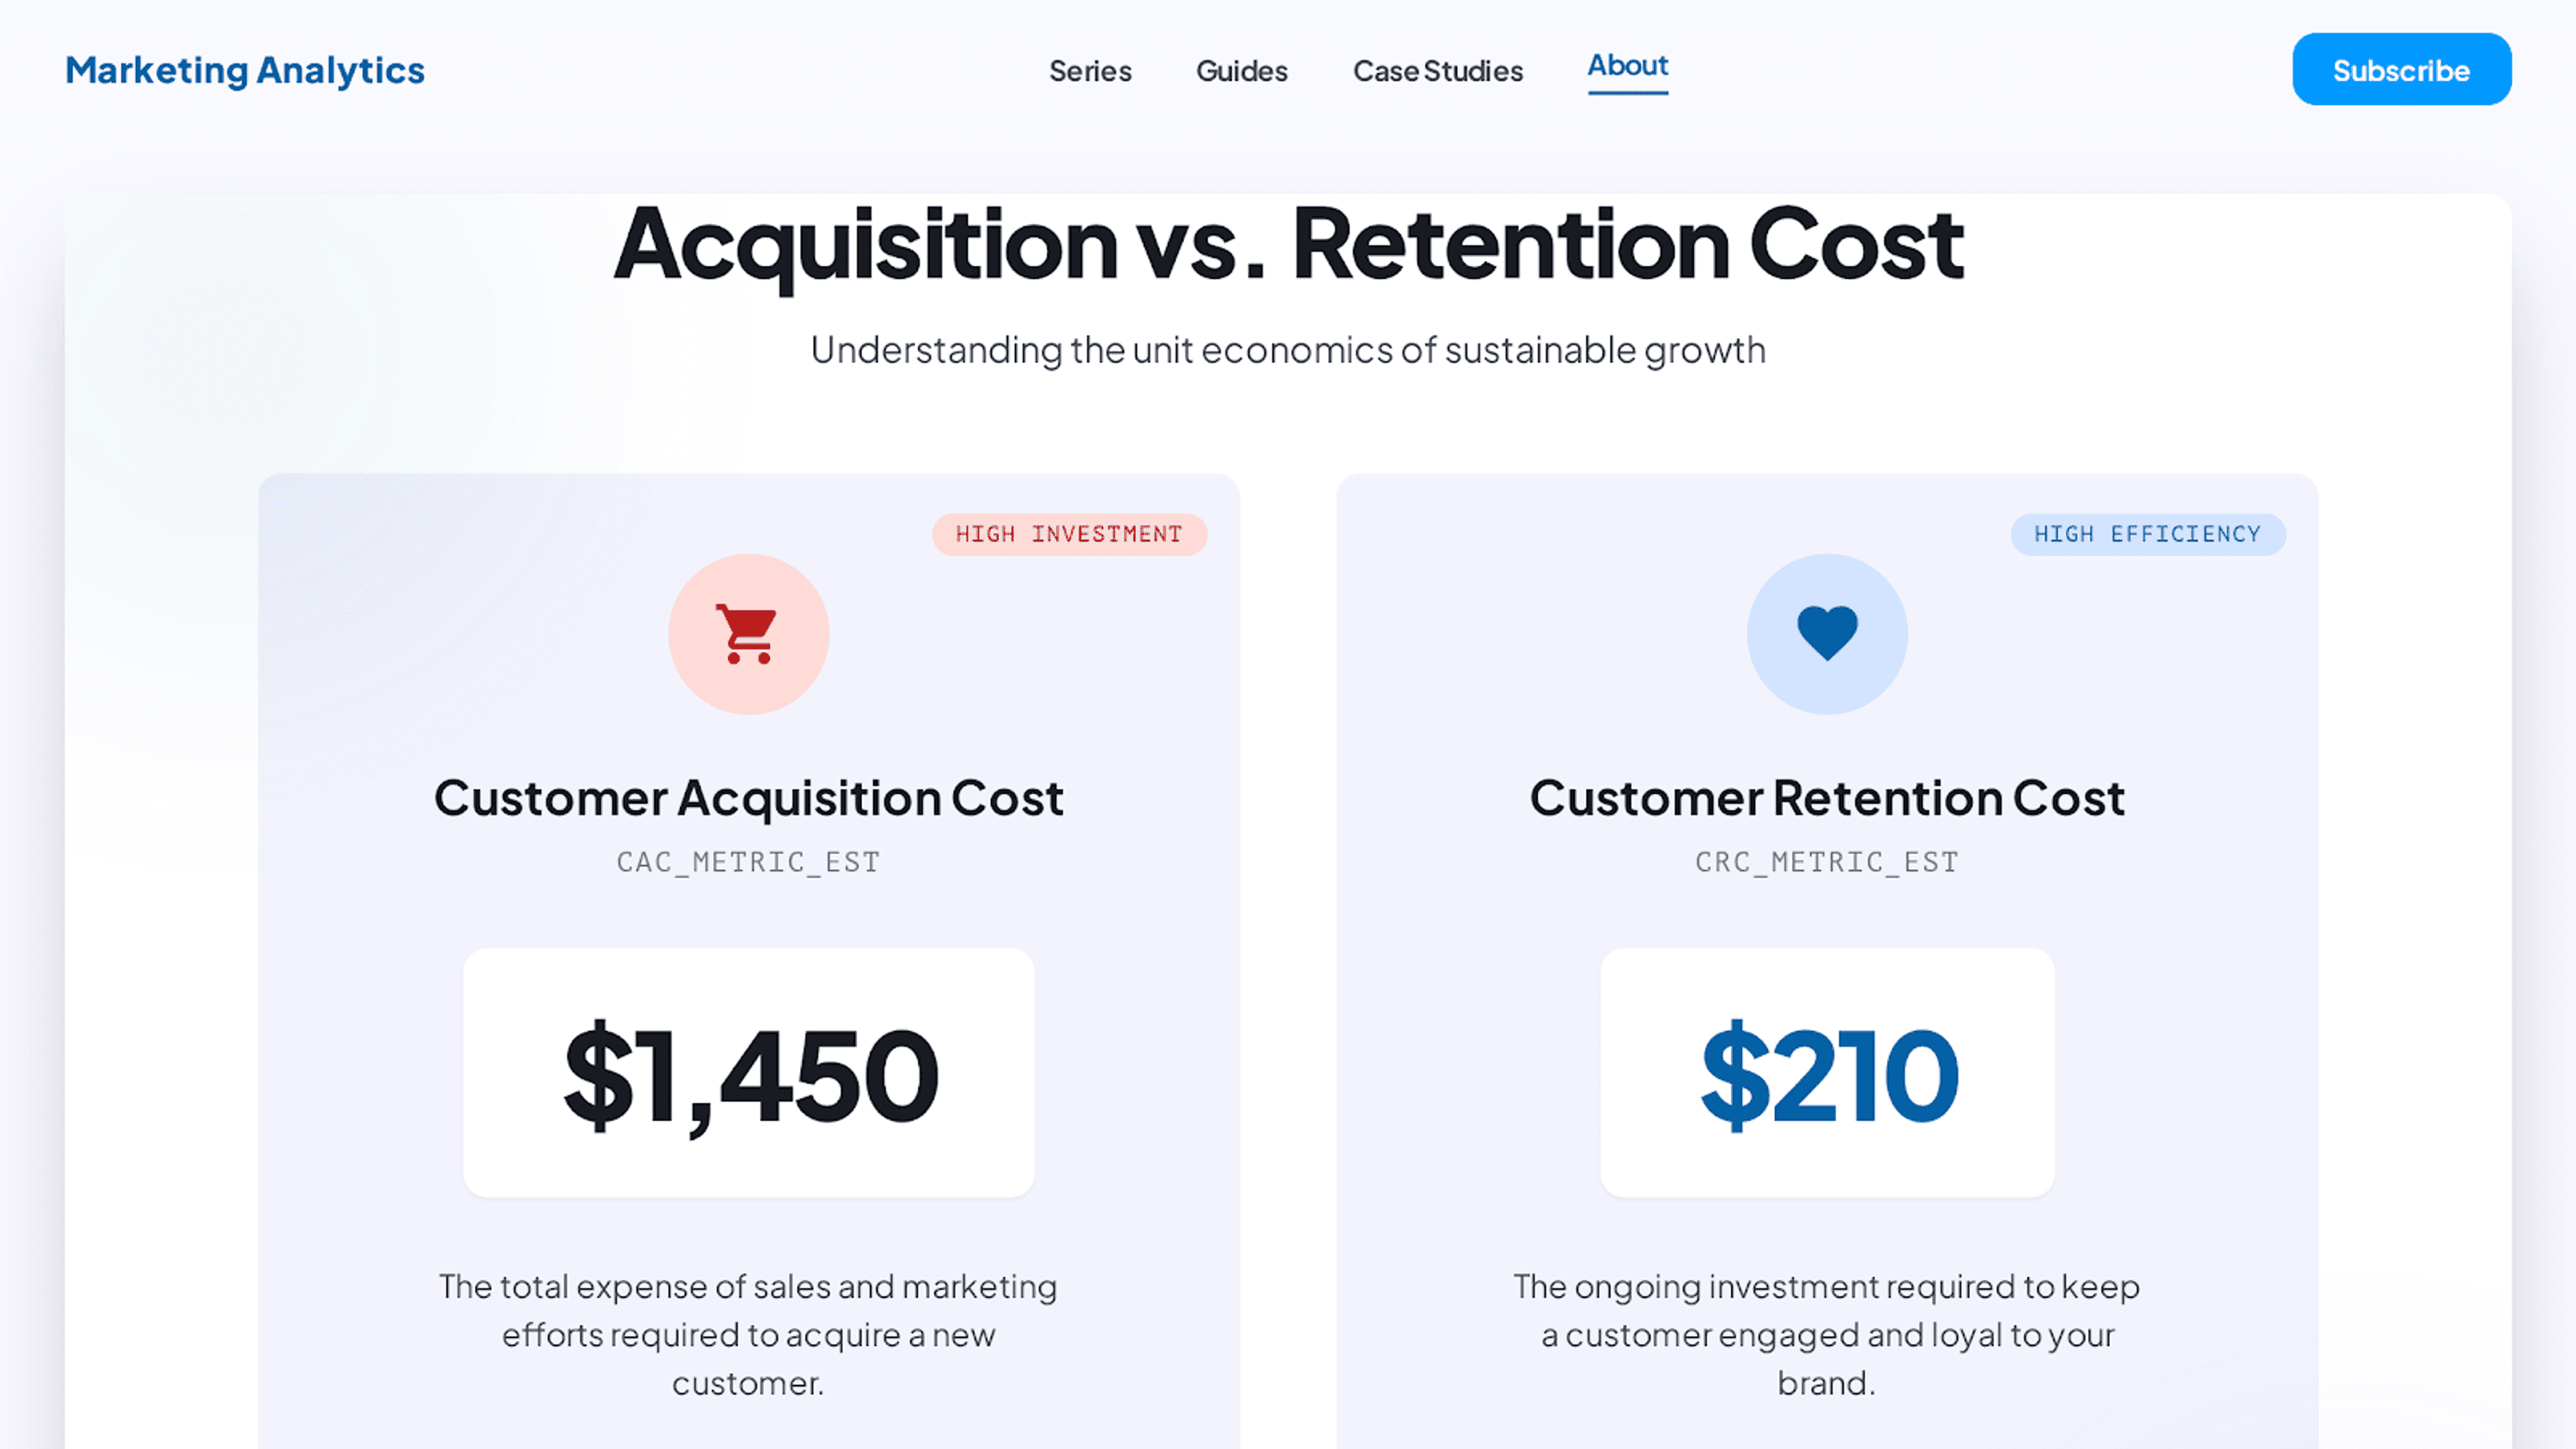
Acquiring a new customer costs 5 to 25 times more than retaining an existing one (Harvard Business Review, Bain and Company). Every customer who buys once and never returns is a paid acquisition that generated a single order. When customer acquisition cost is high and repeat purchase rate is low, the unit economics rarely work.
Repeat customers spend more
Repeat customers are not just returning - they are spending more. Repeat buyers spend 67% more per order than first-time buyers, according to Bain research. They have higher average order values, accept upsells more readily, and move through the purchase process faster because trust is already established.
The top 5% of customers generate 35% of total revenue (Smile.io). These are almost always repeat purchasers. Building a customer base with strong repeat purchase behavior concentrates revenue in your most valuable segment.
Repeat purchases improve profitability
A 5% increase in customer retention can boost profits 25 to 95% (Bain and Company). This range varies by category and margin structure, but the direction is consistent across every industry: retaining customers is significantly more profitable than replacing them with new ones.
The mechanism is straightforward. Returning customers arrive without paid acquisition cost. They convert at higher rates. They generate higher customer lifetime value. And each repeat purchase improves the effective payback on the original acquisition spend.
High RPR usually signals strong customer experience
A high repeat purchase rate is rarely accidental. It reflects product quality customers trust, fulfillment that met their expectations, support that resolved problems quickly, and post-purchase communication that felt relevant rather than intrusive. When RPR drops, something in the customer experience has degraded. When it rises, the opposite is true.
What is the repeat purchase rate formula?
The calculation is straightforward: Repeat Purchase Rate = (Repeat Customers ÷ Total Customers) × 100
- Repeat customers: the number of customers who placed more than one order in your chosen time period
- Total customers: the total number of unique customers who placed at least one order in the same time period
- Time period: typically a rolling 12-month window, though monthly or quarterly windows are useful for trend analysis
The most important rule is consistency. Pick a time window and keep it the same across every calculation so you are comparing like with like.
How do you calculate repeat purchase rate step by step?
Step 1: Choose a time period
Decide on your measurement window before pulling any data. The three most common options are:
- Monthly: useful for spotting short-term trends and testing the impact of campaigns
- Quarterly: good for seasonal businesses that need to compare similar periods
- Yearly (12 months): the standard benchmark for overall RPR performance and year-over-year comparison
Step 2: Count total customers
Pull the total number of unique customers who placed at least one order within your chosen period. Each customer counts once regardless of how many orders they placed.
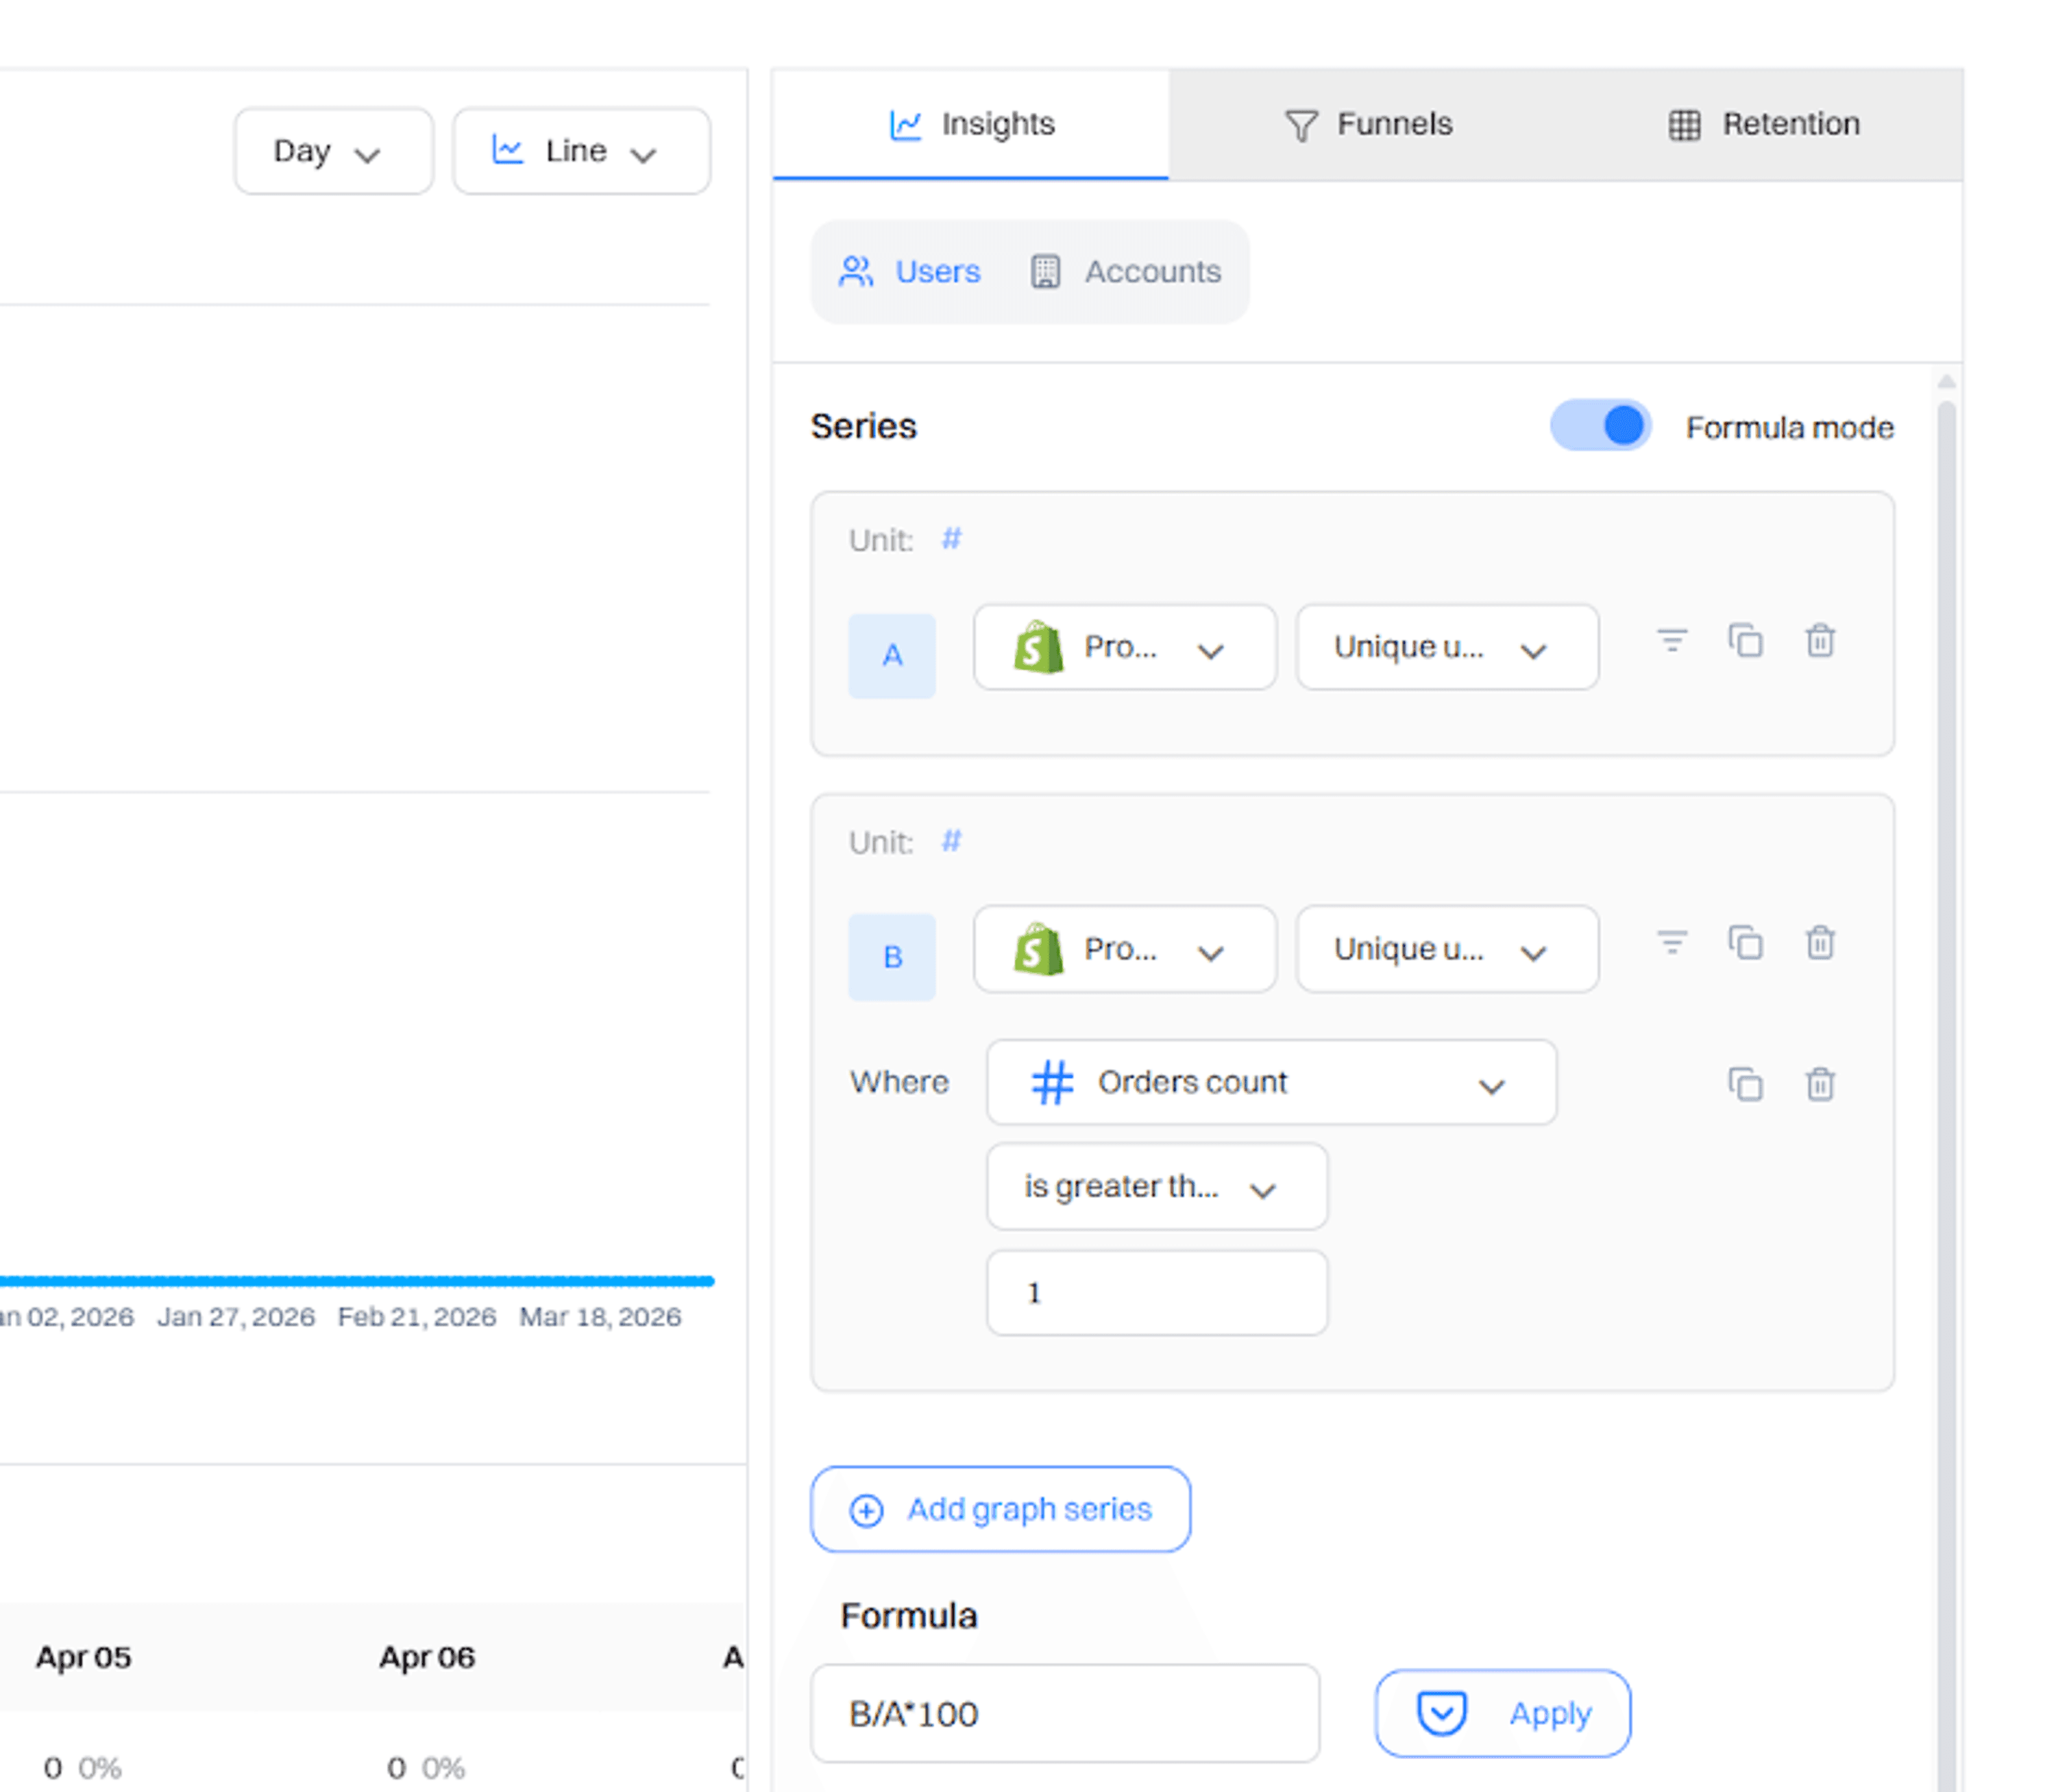
Step 3: Identify repeat customers
From that same period, count the number of customers who placed two or more orders. These are your repeat buyers. Most ecommerce platforms and analytics tools can filter this directly from your order data.
Step 4: Apply the formula
Divide your repeat customer count by total customers, then multiply by 100. Example: Your store had 2,000 customers in the last 12 months. 600 of them placed more than one order. RPR = (600 ÷ 2,000) × 100 = 30%.
Once you have your baseline, segment it. Break RPR down by acquisition channel (paid, organic, email) and by product category. This tells you where the highest-value customers are coming from and which products are driving loyalty, not just what your overall rate is.
What is a good repeat purchase rate?
Why 'good' depends on industry
There is no single benchmark that applies across all ecommerce. A brand selling coffee or supplements expects customers back every 3 to 4 weeks. A brand selling sofas or luxury watches may see customers return once every few years by design. Comparing these two businesses against a single average produces a meaningless number.
Average repeat purchase rate by industry
| Industry | Average RPR |
|---|---|
| Fashion and Apparel | 30 to 40% |
| Beauty and Skincare | 30 to 45% |
| Supplements and Health | 40 to 60% |
| Electronics | 10 to 20% |
| Home Goods | 20 to 30% |
| Luxury Products | 10 to 15% |
| Subscription Ecommerce | 50%+ |
What low vs. high RPR usually means
A low RPR relative to your category benchmark is rarely a product problem. It is almost always a timing, communication, or experience problem.
- Low RPR typically signals: weak post-purchase follow-up, re-engagement timing that does not match the product's replenishment cycle, no personalization, or low brand recall between purchases
- High RPR typically signals: strong product-market fit, a post-purchase experience customers trust, relevant and well-timed re-engagement, and effective loyalty or retention mechanics
How does repeat purchase rate differ from customer retention rate?
These two metrics are often used interchangeably but they measure different things. Understanding the distinction matters for diagnosing problems correctly.
| Repeat Purchase Rate | Customer Retention Rate | |
|---|---|---|
| What it measures | % of customers who bought again | % of customers who stayed active |
| Signal type | Revenue signal | Engagement signal |
| Best used for | Measuring purchase behavior | Measuring brand engagement |
| Time period | Fixed window, usually 12 months | Rolling period |
| Primary use | Retention and post-purchase strategy | Lifecycle and churn analysis |
A customer can have high retention and low RPR - they are opening emails, visiting the site, and staying engaged, but not converting to a second purchase. That combination points to a discovery or offer problem, not a churn problem. Track both. If retention is high but RPR is low, the fix is in your purchase conversion strategy.
What are the most common reasons repeat purchase rate is low?
Weak post-purchase experience
The post-purchase experience begins the moment someone places an order. Delayed confirmations, unclear shipping updates, packaging that disappoints, and no follow-up communication all erode the trust needed to bring a customer back. Most brands invest heavily in pre-purchase experience and treat post-purchase as an afterthought.
Customers forget about your brand
Out of sight is out of mind. If you are not reaching customers between purchases with relevant, well-timed communication, they will forget you exist and buy from whoever shows up when the need arises. Brand recall requires consistent touchpoints.
No personalization
Generic campaigns sent to your entire customer list produce generic results. Customers who bought a specific product do not want emails about unrelated categories. Personalization based on purchase history, browsing behavior, and lifecycle stage dramatically improves re-engagement rates.
Poor product quality or unmet expectations
No retention strategy overcomes a product that failed to deliver. If customers bought expecting one thing and received another, they will not return. Low RPR is sometimes a signal to look upstream at product quality, description accuracy, and expectation setting before investing in retention mechanics.
Slow shipping or support issues
Fulfillment and support are retention variables. Customers who waited too long for their order, had trouble with a return, or received a poor support experience are unlikely to risk a second purchase. Operational problems kill repeat purchase rates quietly and consistently.
No loyalty or referral incentives
Customers in competitive categories often need a reason to choose you again over alternatives. Without loyalty rewards, VIP benefits, or referral incentives, price and convenience will drive their next decision rather than brand preference.
Generic email and SMS campaigns
Sending the same newsletter to all subscribers regardless of what they bought, when they bought, or how recently they engaged is the most common retention failure. Behavioral segmentation and lifecycle automation consistently outperform broadcast campaigns for driving repeat purchases.
What are the 12 proven ways to increase repeat purchase rate?
- Improve the first purchase experience
- Create a post-purchase email flow
- Use personalized product recommendations
- Launch a loyalty program
- Introduce subscription options
- Use replenishment reminders
- Segment customers by behavior (RFM)
- Create win-back campaigns
- Improve customer support
- Launch referral programs
- Bundle complementary products
- Continuously collect and act on feedback
1. Improve the first purchase experience
The foundation of repeat purchasing is a first experience good enough to want to repeat. Fast and accurate delivery, quality packaging, clear communication, and a product that matches its description are non-negotiable. Track what percentage of customers who contact support with a negative issue go on to buy again. This number is almost always close to zero, which tells you where the retention leak starts.
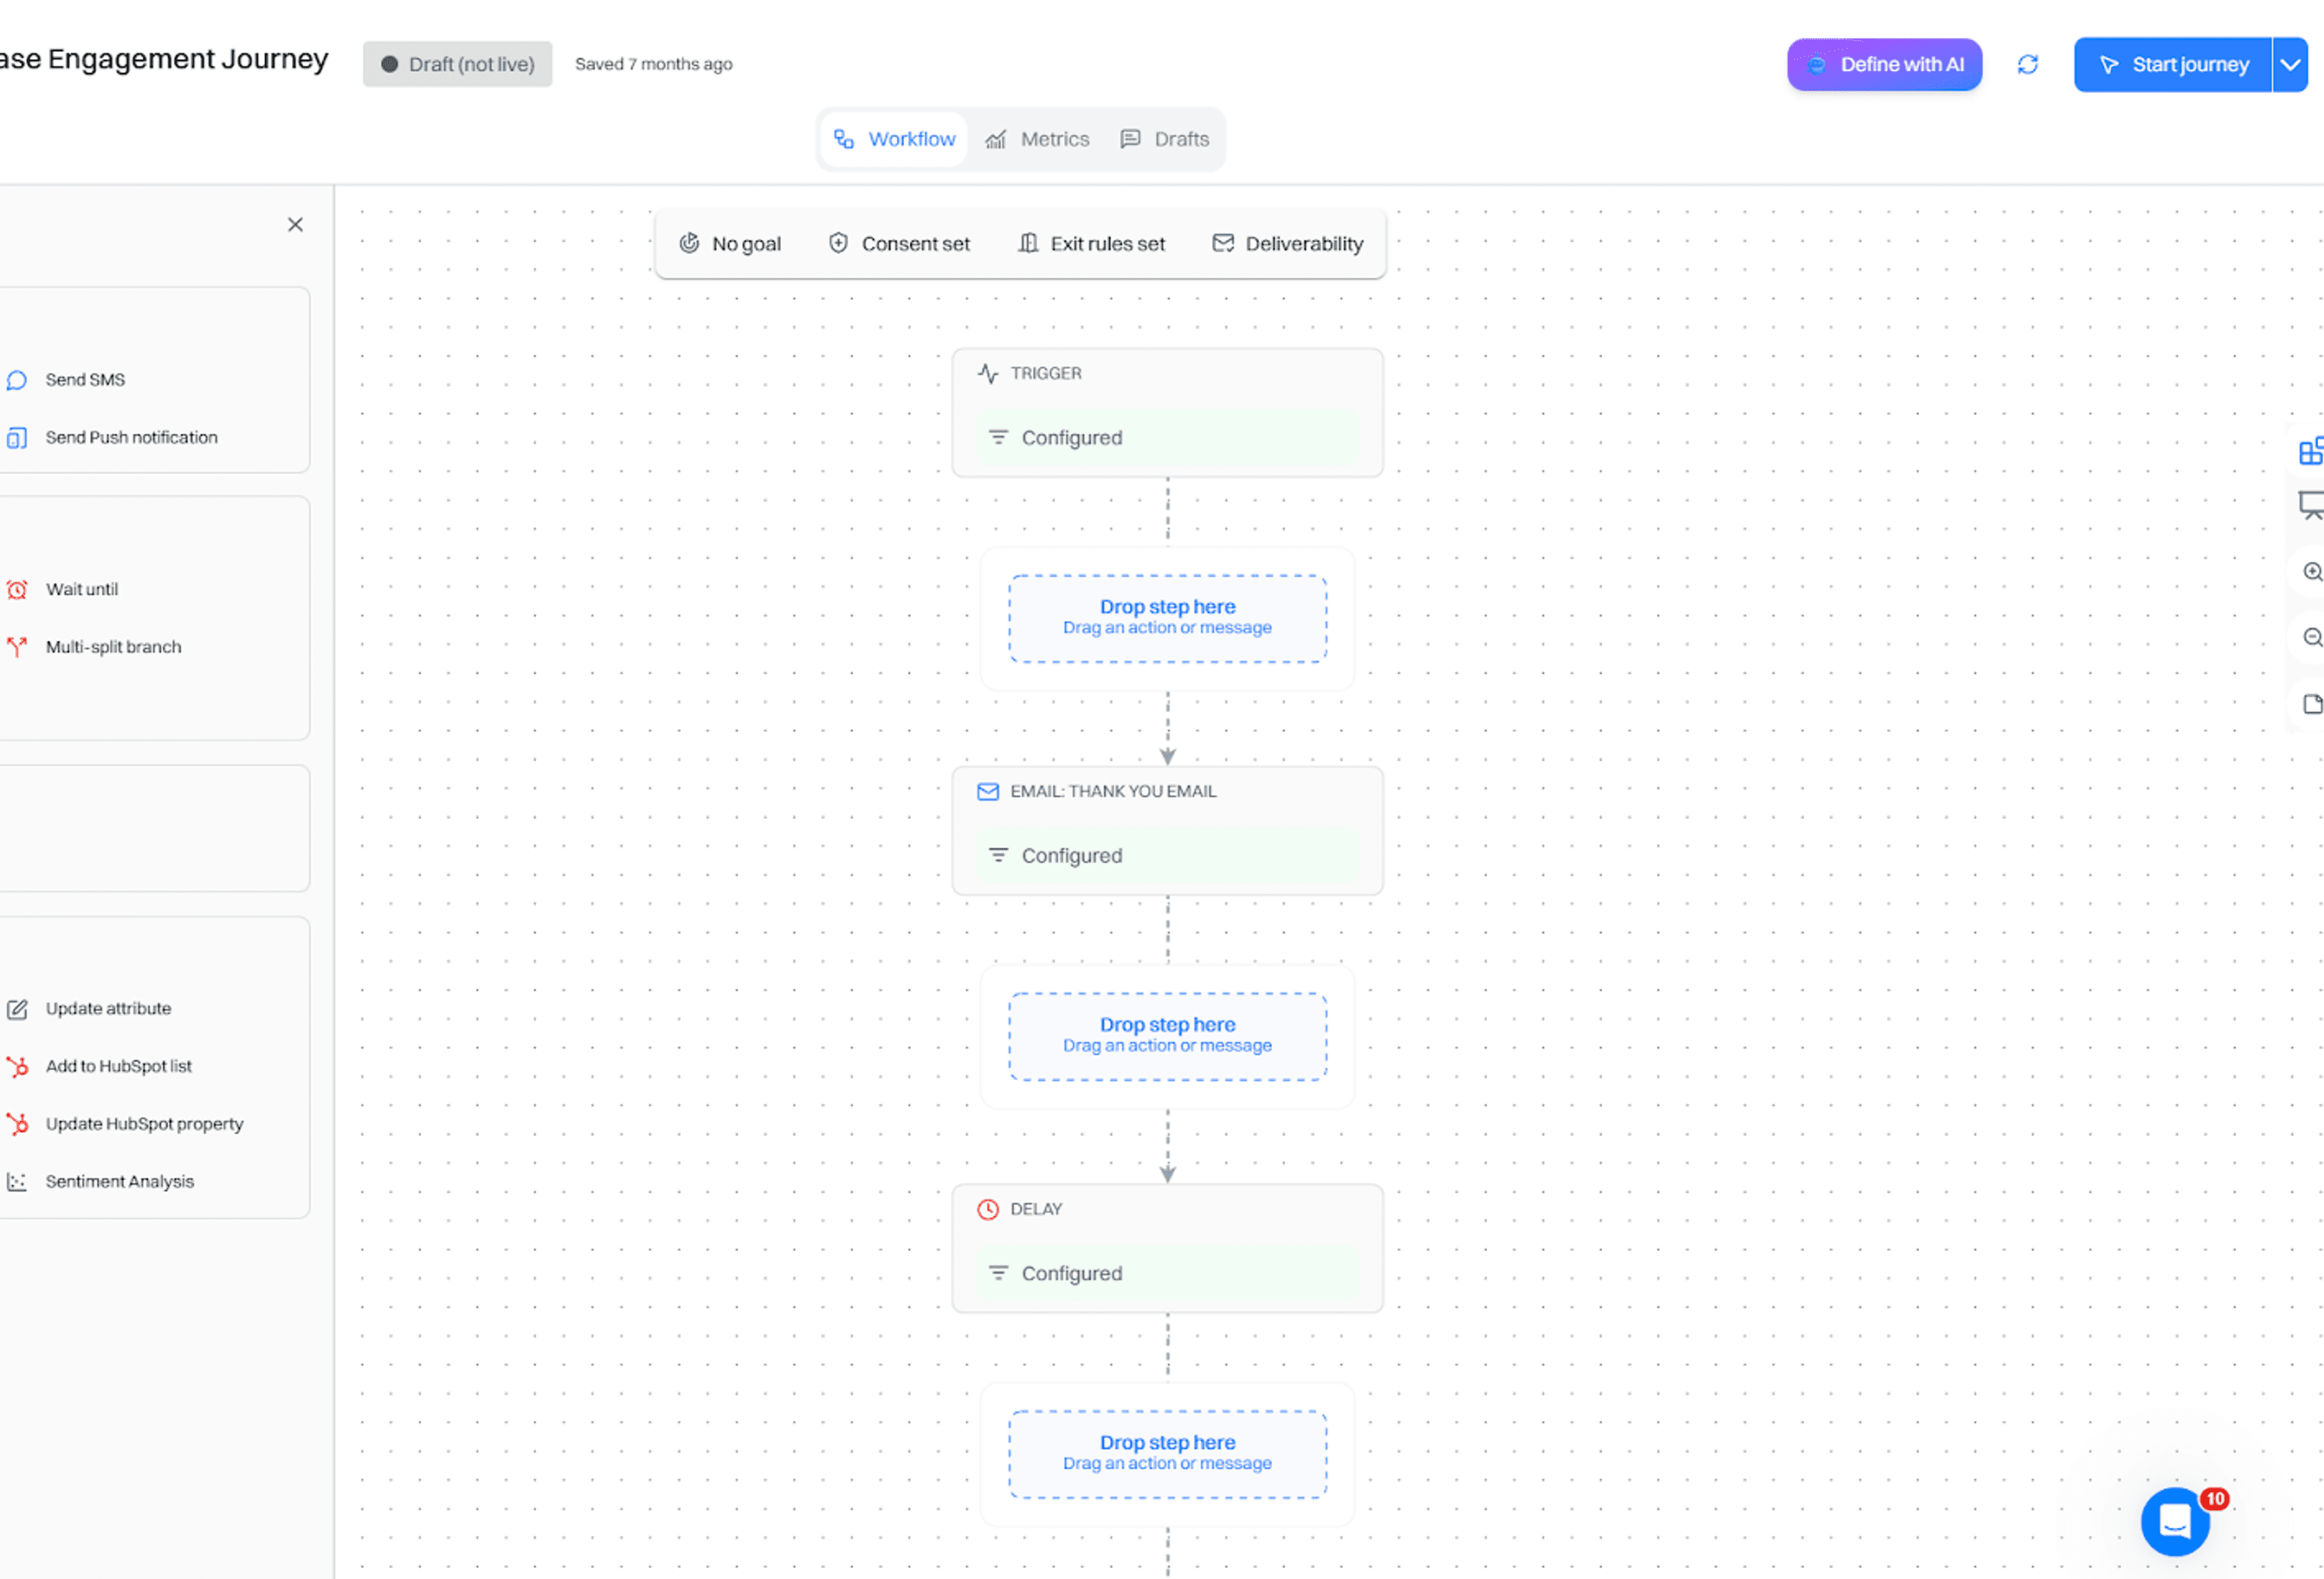
2. Create a post-purchase email flow
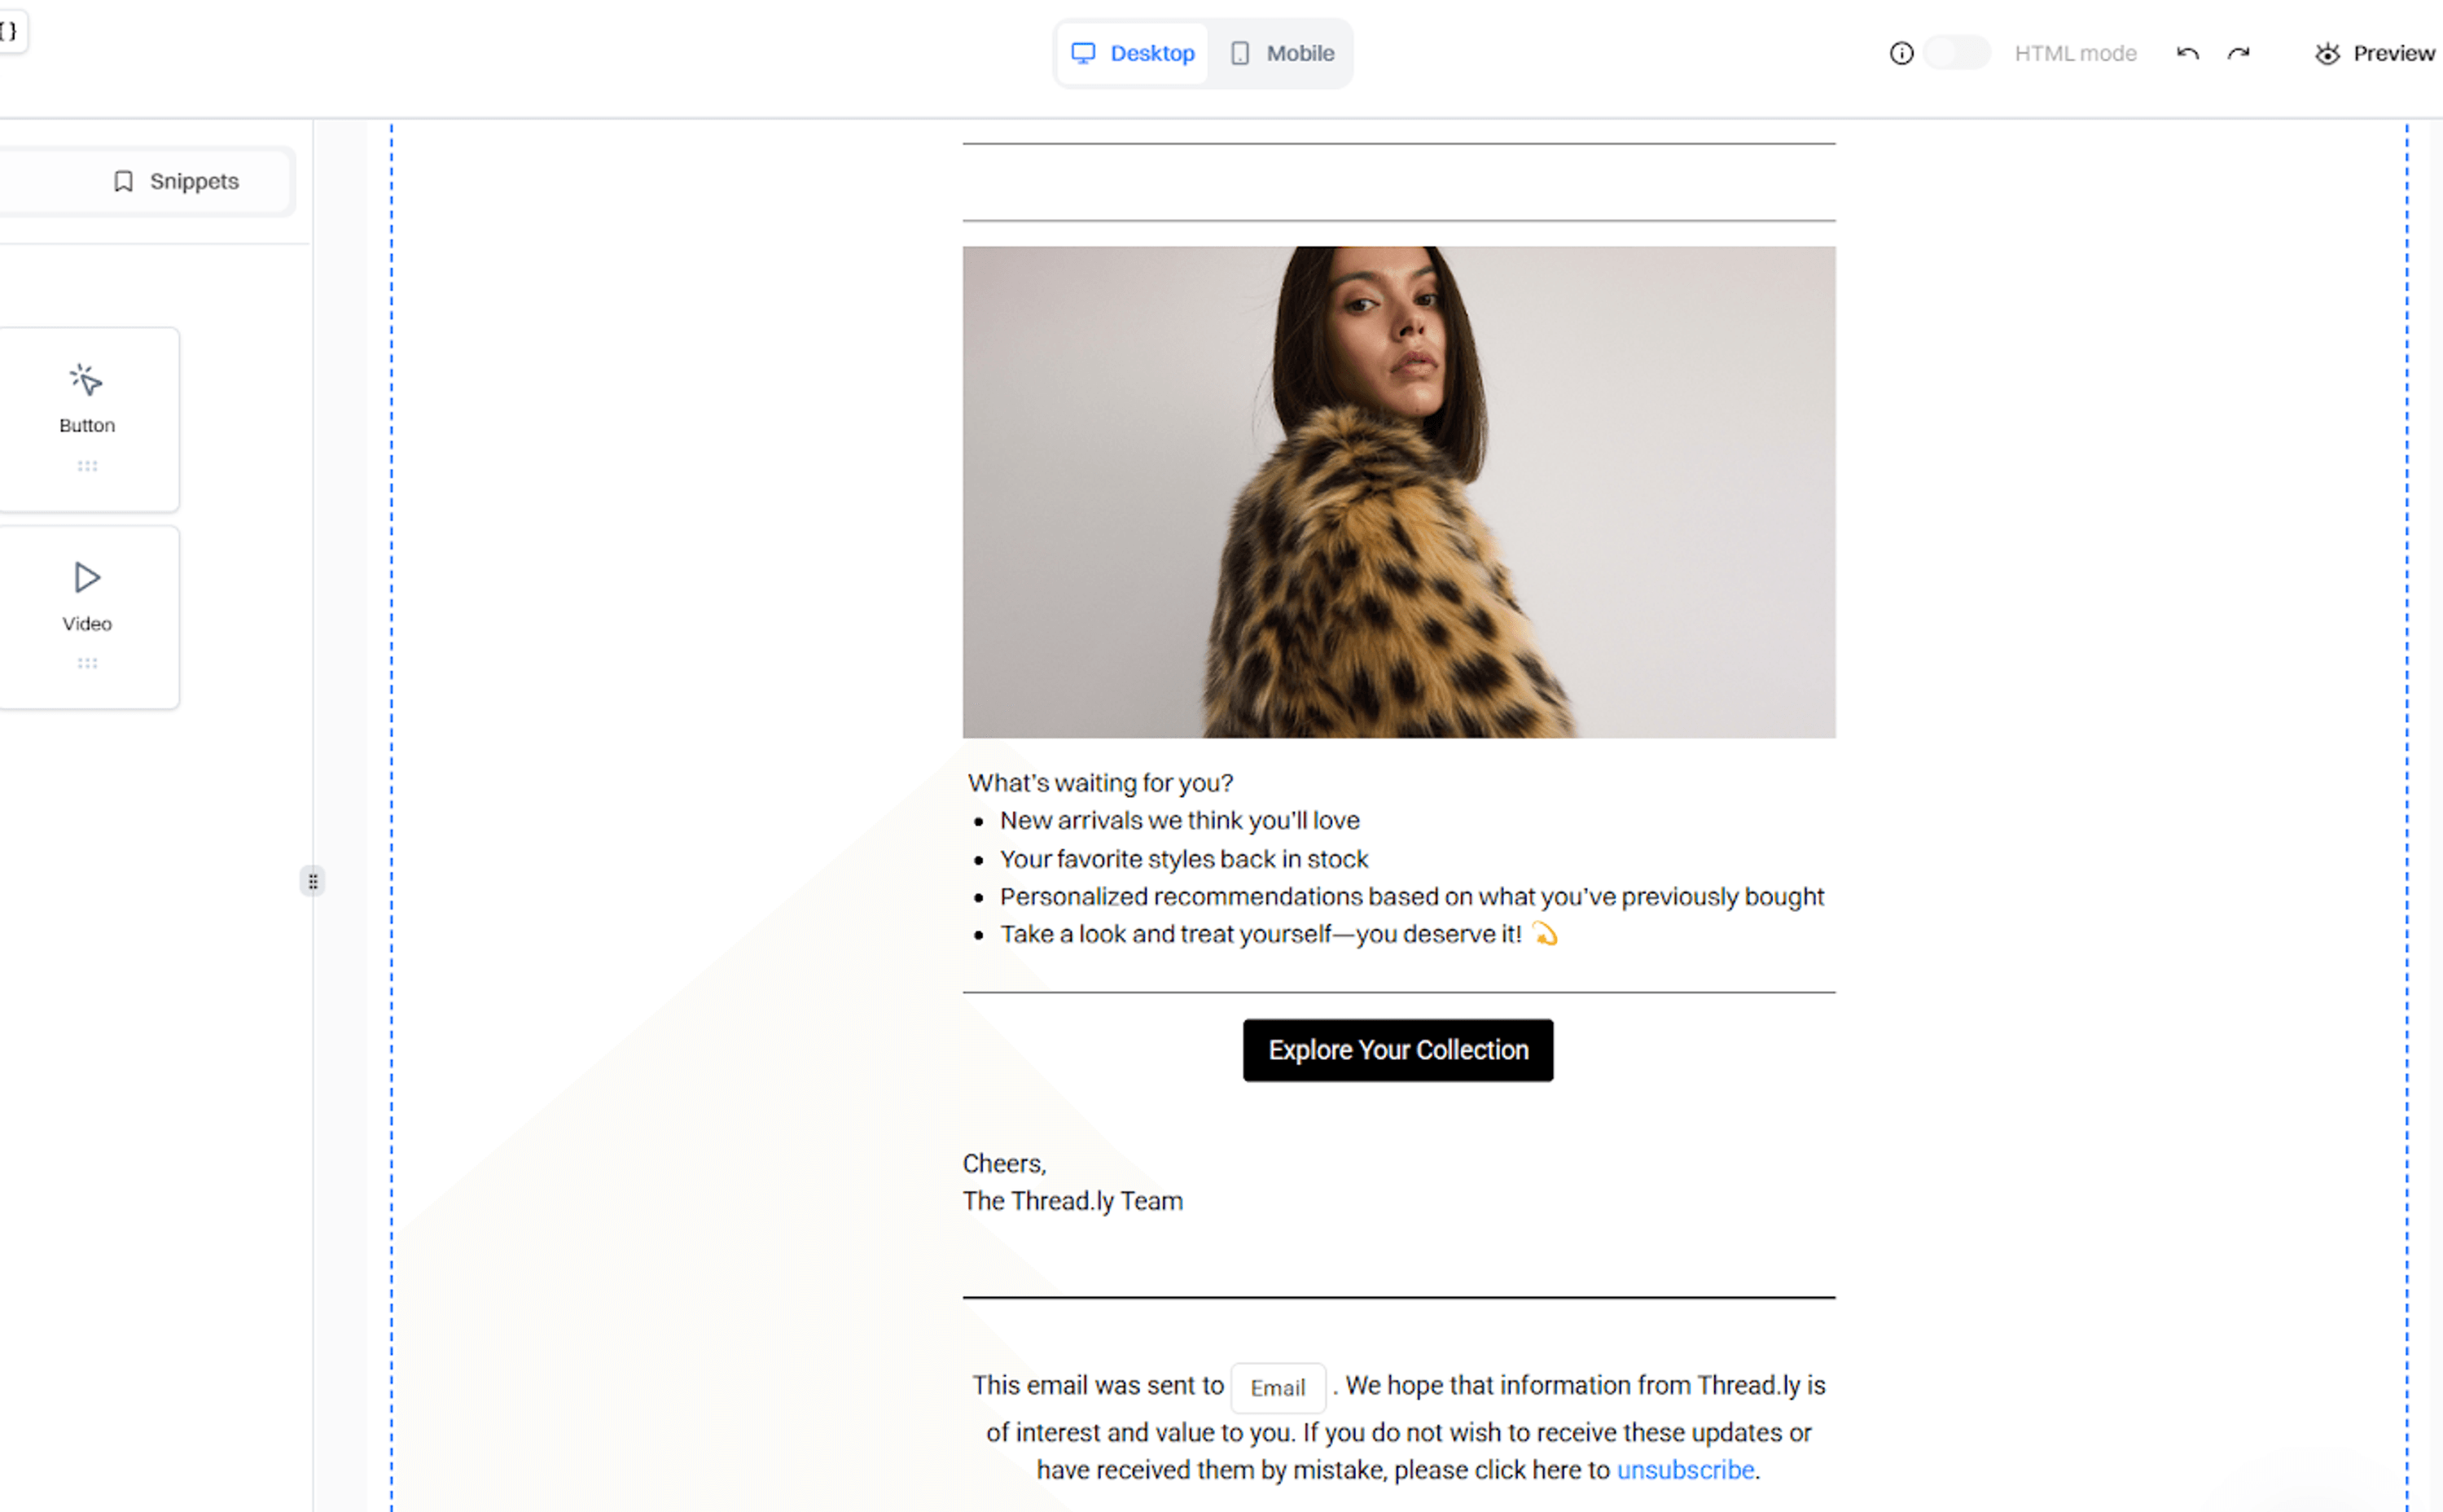
A post-purchase email flow is the single highest-impact tool for increasing repeat purchase rate. It keeps your brand present after the first order, builds trust during the ownership experience, and brings customers back at the right moment.
- Day 3 to 5: delivery confirmation and review request
- Day 5 to 7: product tips or getting-started content if engagement has been low since purchase
- Trigger window day: reorder reminder timed to your product's replenishment cycle, not a fixed calendar date
- Browse without purchase trigger: personalized recommendation email when a customer views a product but does not convert
3. Use personalized product recommendations
Customers who bought product A are more likely to buy product B than a customer who bought nothing. AI-powered recommendation engines use purchase history, browsing behavior, and cohort patterns to surface the right product to the right customer at the right time. Customers who bought the same first product often go on to buy the same second product at predictable rates - that pattern exists in your data and can be surfaced in post-purchase emails, on-site recommendations, and retargeting ads.
4. Launch a loyalty program
Loyalty programs create a structural reason for customers to return. Points, VIP tiers, and exclusive rewards shift the decision from pure price comparison to accumulated value. They work best in categories with natural repeat purchasing behavior: supplements, beauty, pet supplies, and coffee. For categories with longer purchase cycles, loyalty programs have lower ROI - the incentive needs to match the buying frequency.
5. Introduce subscription options
For consumable products, subscriptions are the most reliable driver of repeat purchase rate. The customer never has to decide to return because the decision was already made at checkout. Even a small shift toward subscription revenue significantly improves RPR. A subscribe-and-save offer on your most frequently repurchased products is often the quickest lever available.
6. Use replenishment reminders
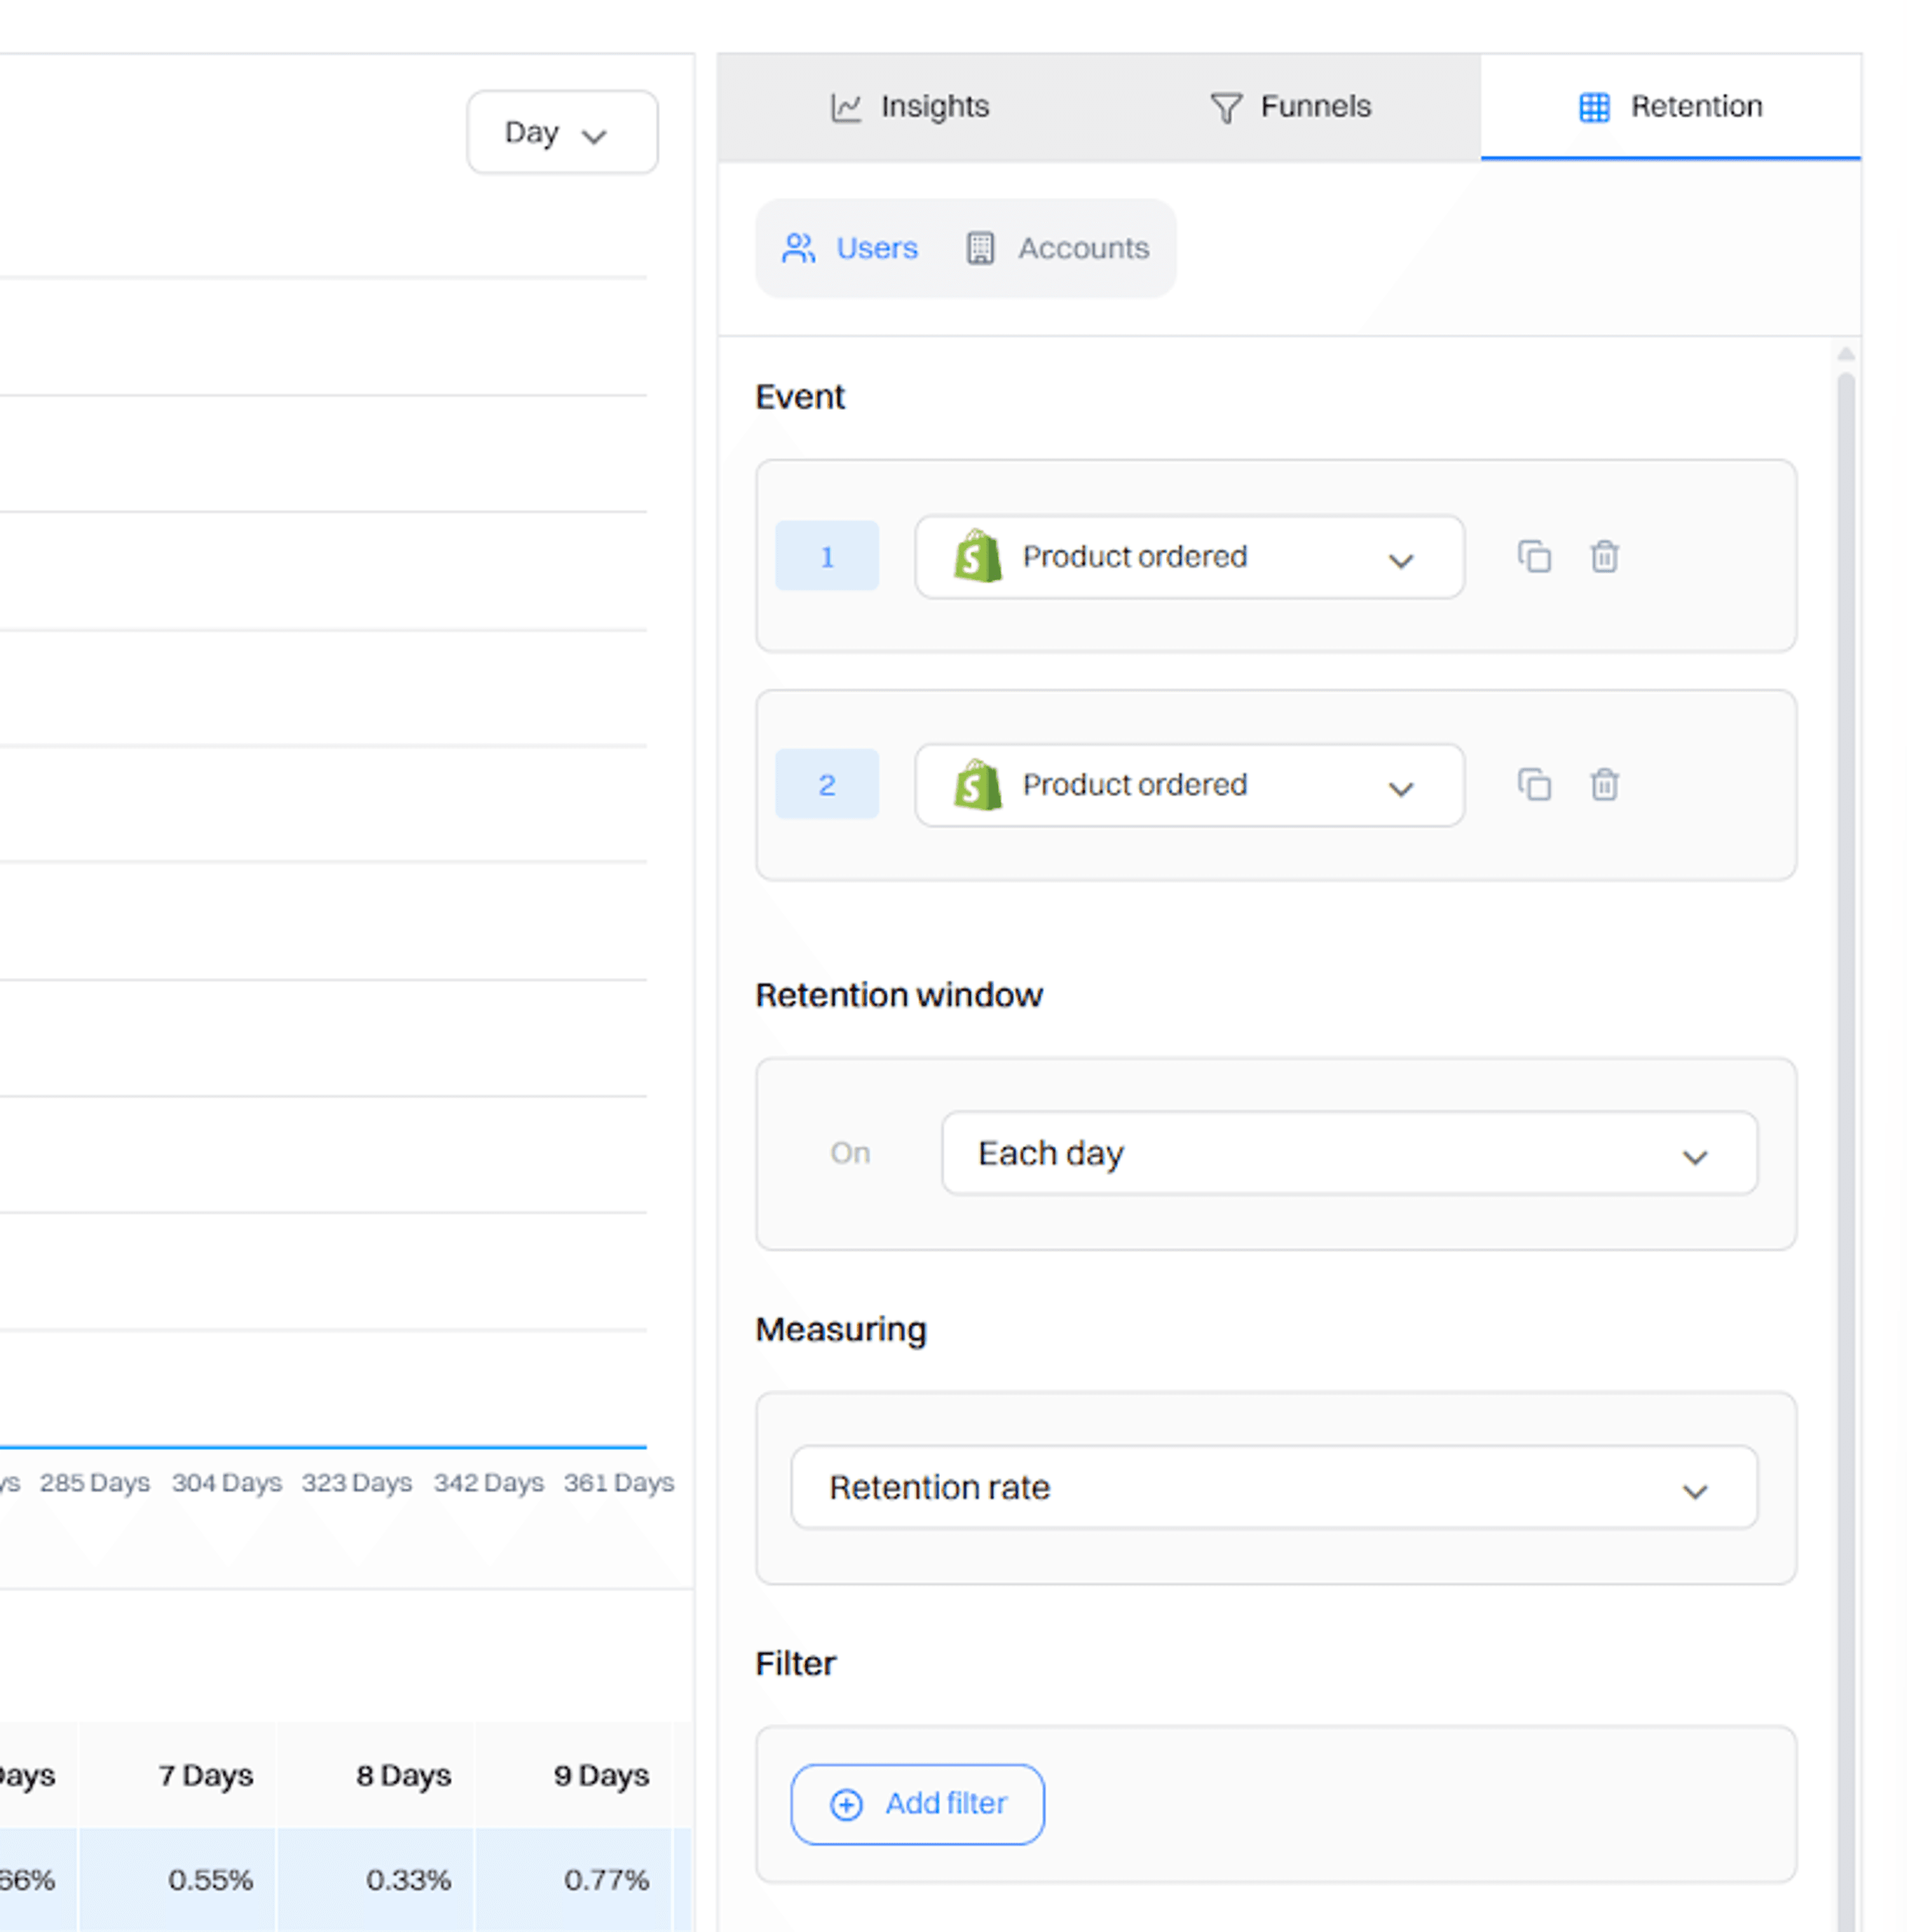
Most brands send re-engagement emails on a fixed schedule - the same delay after every purchase regardless of the product. The alternative is to find your actual trigger window: the average number of days between first and second purchase for customers who did return. Pull a retention cohort report, find the week with the highest return rate, and use that to set your re-engagement timer. Reaching customers when they are running low rather than on a calendar date consistently lifts repurchase rates.
7. Segment customers by behavior
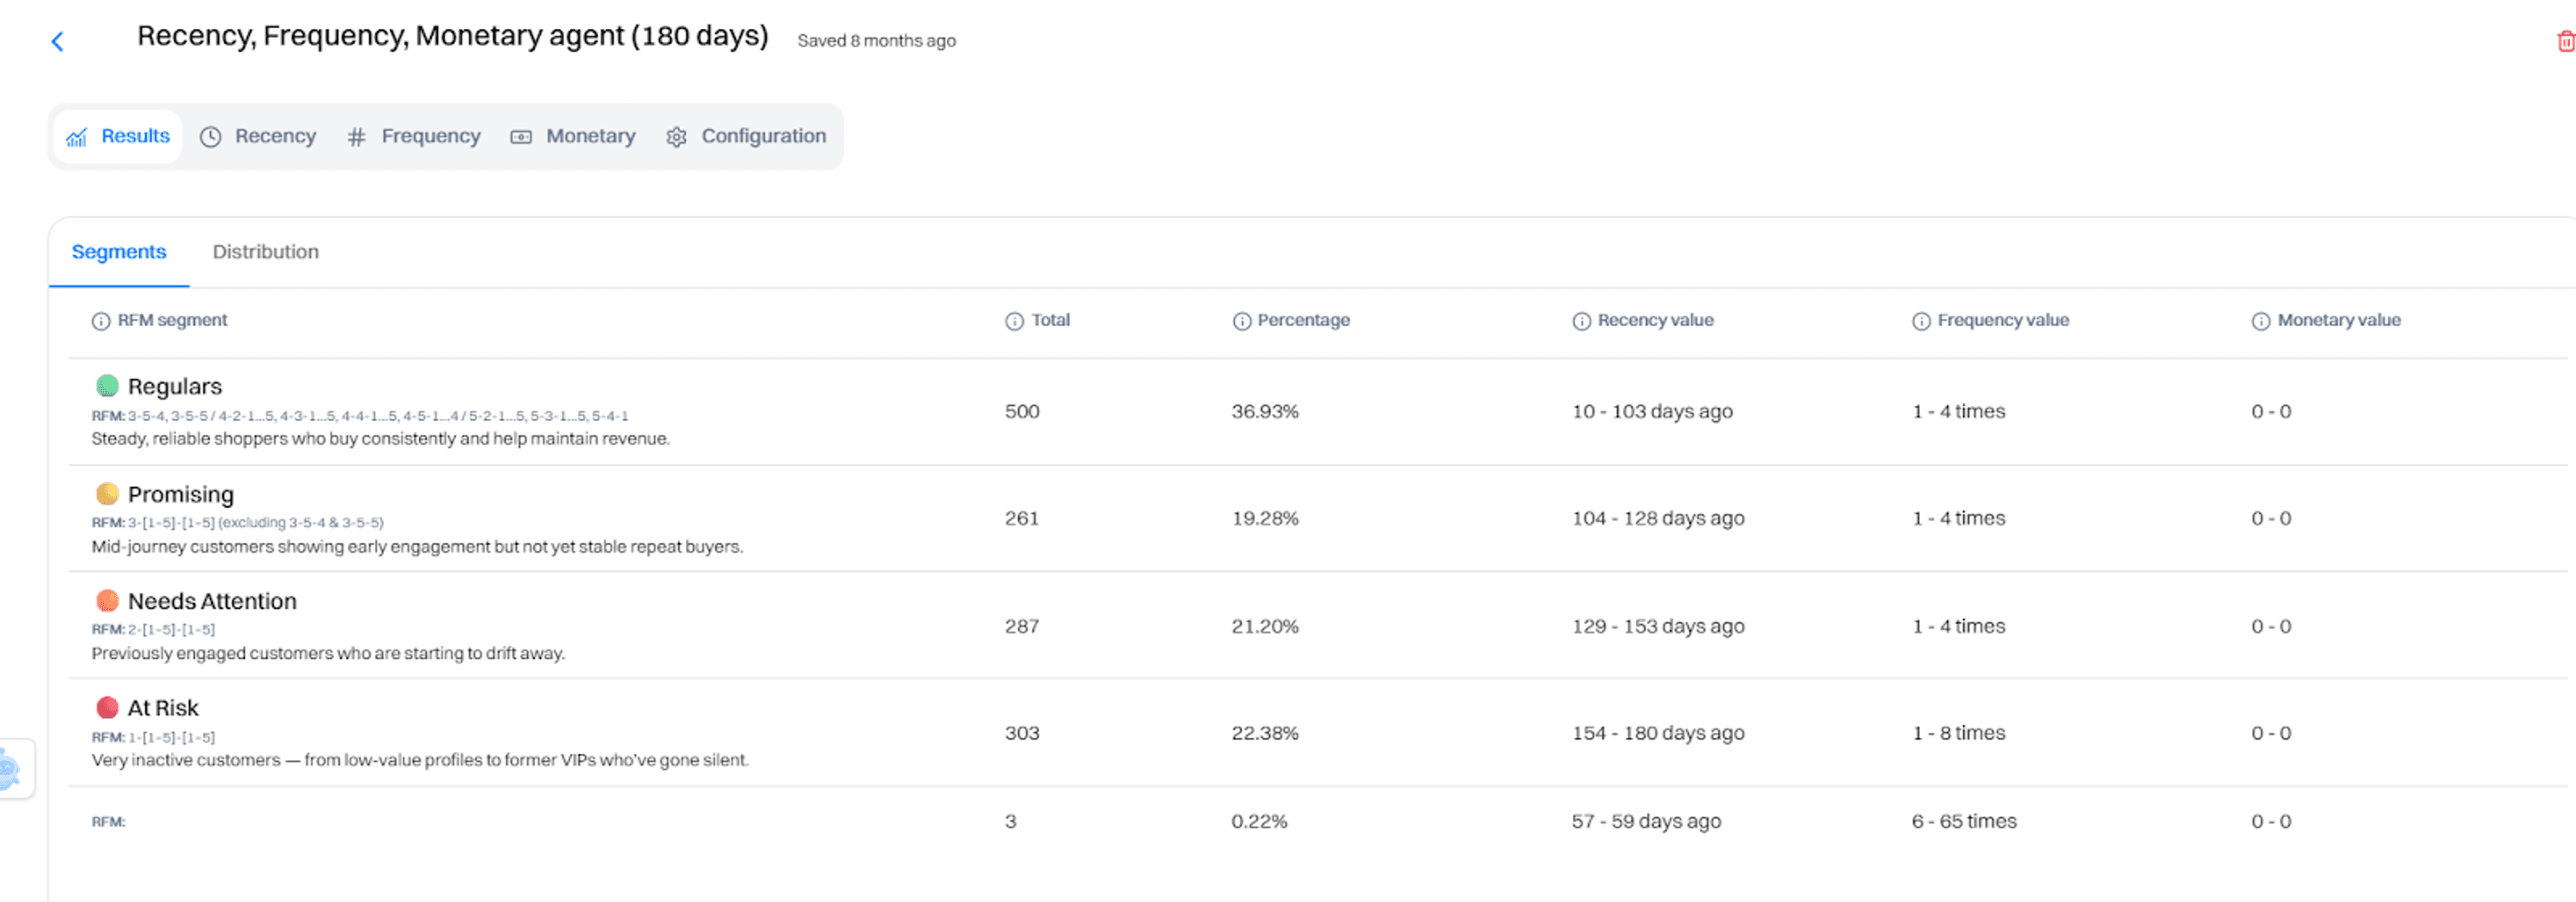
RFM segmentation (Recency, Frequency, Monetary value) is one of the most effective frameworks for targeting re-engagement spend. Instead of sending the same campaign to your entire list, you route customers to different sequences based on where they are in their lifecycle.
- High-value, active customers: protect and reward. Focus on loyalty benefits and early access rather than discounts.
- Recent buyers, not yet repeat: this is your highest-priority segment. They are still warm but have not yet established a habit. Targeted re-engagement here has the highest conversion rate.
- Dormant customers: they bought once and have gone quiet. Win-back campaigns with stronger incentives make sense here, but accept a lower conversion rate.
8. Create win-back campaigns
Win-back campaigns target customers who have already stopped purchasing. They cost more to convert than early re-engagement campaigns and have lower success rates, but they are worth running systematically for recently lapsed customers.
- Start with a re-engagement email that acknowledges the gap: "We have not seen you in a while"
- Follow with your strongest offer or new product if they do not respond
- For very lapsed customers, a final email that acknowledges the relationship may be ending often gets the highest open rates
- Exit customers who do not respond from active campaigns rather than continuing to burn send capacity on them
9. Improve customer support
Support interactions are retention inflection points. A customer who contacts support and gets a fast, helpful resolution is more likely to buy again than a customer who never had an issue. Conversely, a customer who had a bad support experience is almost certainly gone. Tracking RPR by support ticket outcome often reveals one of the clearest signals in your retention data.
10. Launch referral programs
Referral programs drive repeat purchasing in two ways. They give existing customers a reason to re-engage with your brand when they share their referral link. And customers acquired through referral tend to have higher RPR themselves because they arrive with social proof already built in.
11. Bundle complementary products
Product bundles expand the basket at the first purchase and create natural follow-on needs. A customer who buys a skincare cleanser and a matching moisturizer as a bundle will need to replenish both. Bundling introduces customers to more of your catalog in a single transaction, giving them more reasons to return.
12. Continuously collect and act on feedback
Post-purchase surveys, product reviews, and NPS scores are not just reputation management tools. They are retention data. Customers who give you low scores are telling you exactly why they will not return. Acting on that feedback systematically, and closing the loop with customers when you do, is one of the highest-impact RPR improvement strategies available.
Which metrics should you track alongside repeat purchase rate?
Repeat purchase rate becomes more actionable when tracked alongside the metrics that explain it and compound it.
| Metric | What it measures | Why it connects to RPR |
|---|---|---|
| Customer Lifetime Value (LTV) | Total revenue a customer is expected to generate | RPR is a primary driver of LTV. Higher RPR means more purchases per customer, which extends lifetime value directly. |
| Customer Acquisition Cost (CAC) | Total cost to acquire a new customer | As RPR rises, the effective CAC per dollar of revenue falls. Retained customers generate revenue without new acquisition spend. |
| Average Order Value (AOV) | Average spend per order | Repeat customers have higher AOV. Tracking both shows whether your most loyal customers are also your highest-value ones. |
| Purchase Frequency | Average number of orders per customer per period | RPR measures whether customers return. Purchase frequency measures how often. Both are needed to understand the full retention picture. |
| Churn Rate | % of customers who stop buying in a period | High churn directly suppresses RPR. If RPR is improving but churn is also rising, you are replacing churned customers with new ones rather than building a loyal base. |
| Customer Retention Rate | % of customers who remain active | High retention with low RPR signals engaged but non-converting customers. Both metrics together diagnose where in the journey customers are dropping off. |
Which tools help increase repeat purchase rate?
Improving repeat purchase rate requires operational infrastructure across several categories. No single tool solves all of it.
- Loyalty platforms: Smile.io (free plan available, paid from $49/month), LoyaltyLion (from $359/month), and Yotpo Loyalty (custom pricing) build points, referral, and VIP tier mechanics directly into the shopping experience
- Lifecycle automation: Klaviyo (free up to 250 contacts, from $45/month for 1,000) and Attentive (custom pricing) power post-purchase email and SMS flows with behavioral triggers
- AI personalization and recommendations: tools that use purchase history and browsing behavior to surface relevant products in email, on-site, and in ads
- Retention analytics: cohort analysis and RFM segmentation tools that identify at-risk customers before they lapse
- Subscription management: Recharge (from $99/month plus transaction fees) for brands moving customers from one-time purchases to recurring orders
Brands using AI personalization and retention automation as connected systems - rather than isolated point tools - typically see significantly higher repeat purchasing behavior. The advantage comes from data flowing between systems: purchase events trigger the right message at the right time without manual orchestration.
How have leading brands successfully increased their repeat purchase rates?
Chewy: removing the repurchase decision entirely
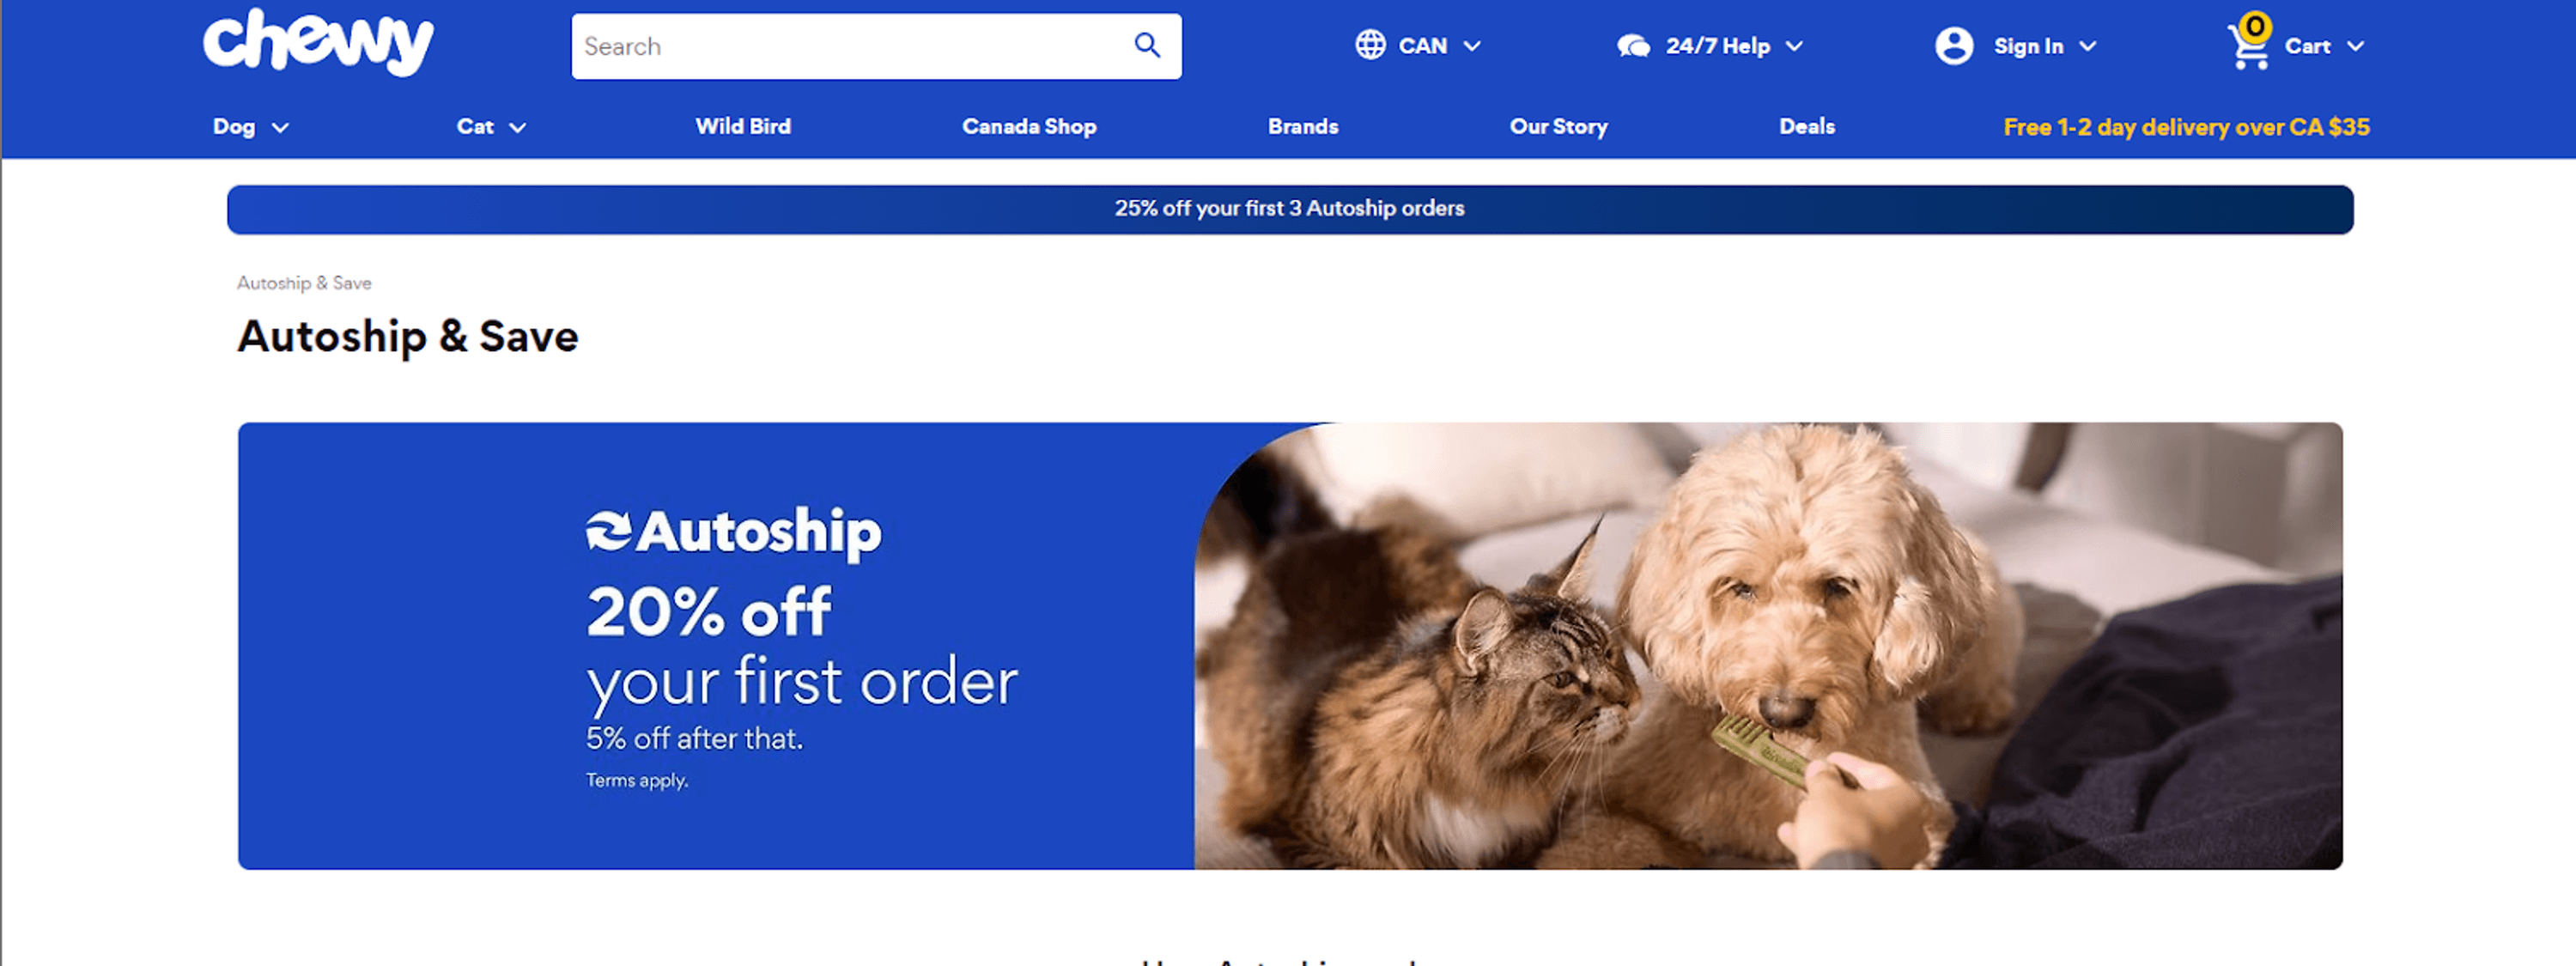
Chewy recognized that pet food is a habitual repurchase category with a predictable cycle. Instead of sending re-engagement emails after customers stopped buying, they removed the repurchase decision entirely. Their Autoship program lets customers set their replenishment frequency at checkout. 78% of Chewy's sales now come through auto-ship, and approximately 90% of their revenue comes from existing customers. The mechanism was not loyalty points or discounts - it was eliminating the gap between replenishment need and reorder.
Sephora: using purchase data to drive personalized repeat purchasing
Sephora's Beauty Insider program has over 40 million members and accounts for 80% of North American sales. The program is not just a points system - it is a data infrastructure. Every purchase feeds a profile that powers personalized recommendations, tier-based offers, and targeted re-engagement. The result: a 22% increase in cross-sell revenue and up to 51% improvement in upsell revenue.
Dollar Shave Club: flexibility as a retention mechanism
Dollar Shave Club built its model around the shaving replenishment cycle and held the highest customer retention rate in the men's grooming subscription category. Around 50% of customers acquired in 2014 to 2015 were still active subscribers at month 12. The driver was not price - it was flexibility. Customers could pause, swap products, or adjust frequency at any time. Rigidity drives churn. Flexibility drives retention.
Repeat purchase rate is one of the most actionable metrics in ecommerce. It tells you whether the customers you are paying to acquire are staying, and whether the experience you are delivering is strong enough to bring them back. Start by calculating your baseline RPR segmented by acquisition channel. Then find your trigger window and build a post-purchase flow timed to your actual replenishment cycle rather than a calendar assumption. The right retention infrastructure - connecting behavioral data, personalized communication, and lifecycle automation - helps turn one-time buyers into loyal customers without proportionally increasing cost. Intempt is built around exactly this model. The replenishment cross-sell journey is a real, runnable version of that trigger-window logic.
Frequently asked questions. Answered.
Repeat purchase rate (RPR) is the percentage of customers who make more than one purchase from your store within a defined time period - calculated as (Repeat Customers ÷ Total Customers) × 100. Industry averages: subscription ecommerce 50%+, supplements and health 40–60%, beauty and skincare 30–45%, fashion 30–40%, home goods 20–30%, electronics 10–20%, luxury goods 10–15%. A 5% increase in retention can boost profits 25 to 95% (Bain and Company). Acquiring a new customer costs 5 to 25 times more than retaining one (Harvard Business Review). Repeat buyers spend 67% more per order than first-time buyers.