
- Customer lifetime value gets computed as one number and used for three different jobs, which is why it rarely changes a decision. Value to date is an accounting fact. Lifetime projection is a forecast you cannot check until the customer has already gone. Fixed-horizon forward value is the only one you can act on this quarter, and it only works per segment, because an average across a weekly buyer and an annual buyer describes neither.
Customer lifetime value is quoted in almost every growth review and it changes almost nothing, because the single number on the slide is being asked to do three different jobs at once. This guide separates the three, shows which one you can actually act on, and covers how to compute it against your own data with automated customer journeys or by hand.
What customer lifetime value actually measures
It measures the profit you expect from one customer across the whole relationship. That is the definition everyone agrees on, and it is where the agreement stops.
The standard formula is average order value multiplied by purchase frequency multiplied by average lifespan. Bain's Fred Reichheld established the underlying economics, summarised in Harvard Business Review: a five percent lift in retention moves profit somewhere between 25 and 95 percent. The range is that wide because it depends entirely on which customers you keep.
So the economics are real. The problem is the number, not the concept.
The three numbers people call lifetime value
Every team computes at least two of these and calls them the same thing. Each is legitimate for one job and misleading for the other two.
| Number | What it is | Good for | Breaks when |
|---|---|---|---|
| Value to date | Profit already realised from this customer | Ranking existing customers, tiering, deciding who gets service | Used as a forecast. It says nothing about what happens next. |
| Lifetime projection | Value to date extrapolated over an assumed lifespan | Board slides, unit-economics narratives | Compared to a cost you paid this quarter, or checked. You cannot verify it until the customer is gone. |
| Forward value on a fixed window | Expected profit over the next 90 days or 12 months | Budget decisions, acquisition caps, deciding who to intervene on now | Applied to one blended average instead of per segment. |
The third row is the one that changes what you do this quarter. It is also the one most dashboards do not show.
Why the lifetime projection cannot be checked
A lifetime projection needs an average lifespan, and lifespan is only knowable once a customer has already churned. So the input is drawn from customers who have left, and applied to customers who have not.
That makes it a retrospective number wearing a forecast's clothes. It is not useless. It is just not evidence, and it should never be the number you compare an acquisition cost against.
A forward window fixes this by removing the unknown. Over 90 days or 12 months you are extrapolating two or three purchase cycles rather than a whole relationship, and the window closes soon enough that you find out whether you were right.
Why one average is worse than no number
An average across segments describes a customer who does not exist, and hides the two facts you needed.
Take a catalogue with a weekly consumables buyer and an annual furniture buyer. They can produce an identical mean. One needs a replenishment nudge inside a fortnight; the other needs nothing for ten months and a considered-purchase sequence in the eleventh, which is the sort of split retention by customer state is built on. The mean tells you to do something in between, which is wrong for both.
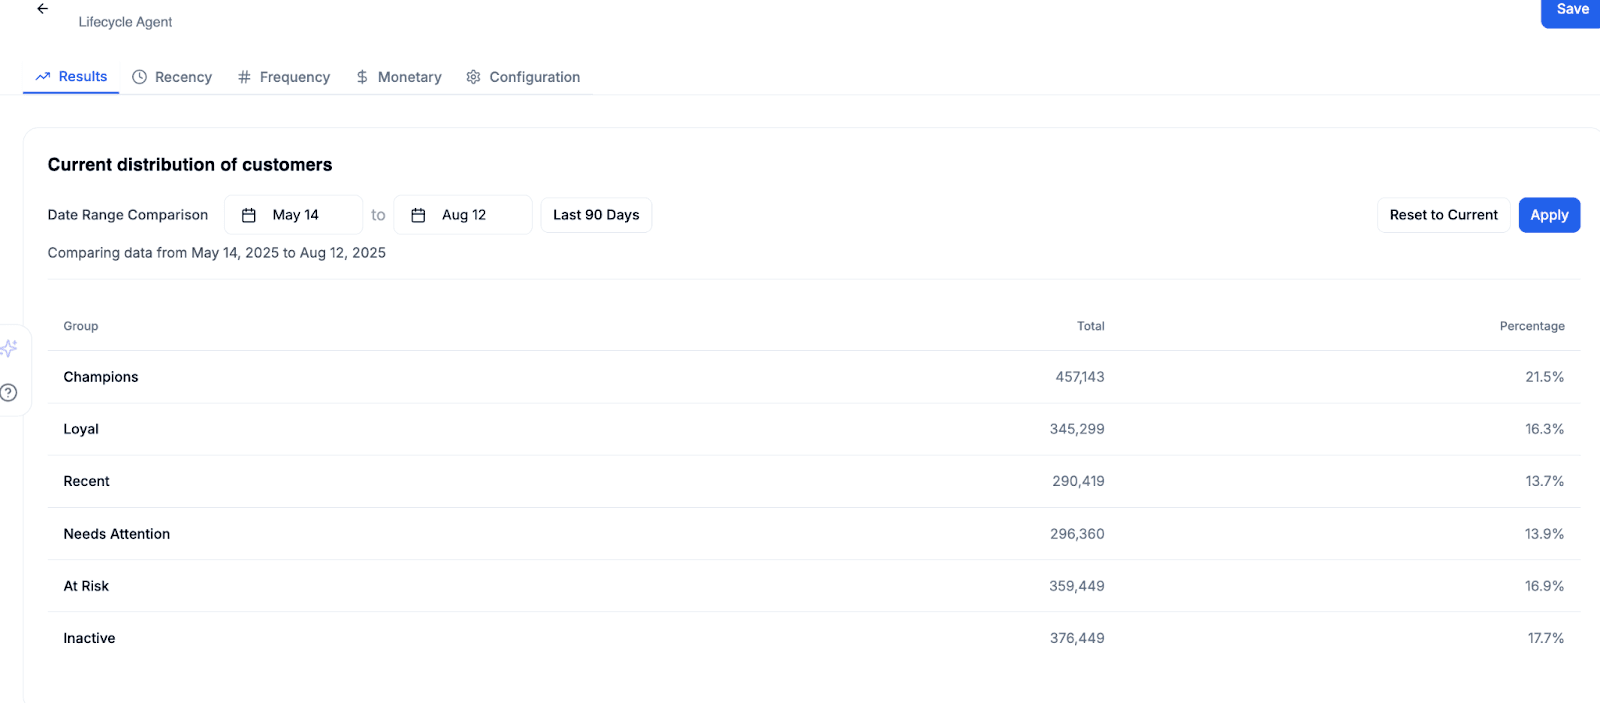
Segment first, then compute. The unit that carries a useful forward value is a segment with a shared purchase cycle, not the customer base.
How to compute forward value per segment
Four inputs, all derived from each segment's own history rather than a site-wide average. The docs cover behavioral segmentation for the mechanics.
- Purchase cycle. The median days between consecutive orders for customers in that segment. Median, not mean, so one seasonal spike does not distort it.
- Expected orders in the window. Window length divided by purchase cycle, discounted by the segment's observed repeat rate rather than assuming every cycle produces an order.
- Contribution per order. Average order value minus variable cost to serve. Gross revenue overstates forward value on anything with real fulfilment cost.
- Survival through the window. The share of that segment historically still ordering at the end of a window this long. This is where churn enters, bounded, instead of as an assumed lifespan.
Multiply the last three. The output is expected contribution per customer over a window you chose deliberately, per segment, and it is falsifiable when the window closes.
Choosing the window
The window has to contain two or three purchase cycles for that category. This is the same cycle logic behind lifecycle marketing generally. Shorter and you are measuring noise; longer and you are back to guessing a lifespan.
- Consumables and subscriptions. 90 days usually holds two or three cycles.
- Mid-consideration retail. Six months, because the cycle is quarterly at best.
- Considered and big-ticket purchases. 12 months minimum, and expect wide confidence intervals.
- B2B with annual contracts. Match the window to the renewal period, not the fiscal quarter.
Pick it from the category's repeat cycle, never from the reporting calendar. A quarterly window on an annual purchase cycle reports zero forward value for healthy customers.
Reading forward value against acquisition cost
This is the comparison the three-to-one rule is reaching for, and it only works when both sides cover the same period.
Acquisition cost is a receipt from this quarter. Comparing it to a lifetime projection compares a fact to a guess. Comparing it to 12-month forward value compares two numbers with the same timeframe, which is a decision you can defend.
Do it per segment as well. A blended ratio that clears three to one can hide a segment acquired at a loss, subsidised by one that would have converted anyway.
Keeping the number current
Forward value moves every time a customer orders, so a figure computed on Monday is wrong by Wednesday. The number is only useful if the segment behind it recomputes.
This is the practical difference between a dashboard and a data layer. Intempt recomputes segments continuously against live behaviour, so a customer whose order gap closes moves tier without anyone rebuilding a list, and the journey and the on-site experience read that same tier.
Forward value only stays honest if the segment behind it moves when a customer orders, which is what the agentic GTM platform is doing between report refreshes.
The high-value customer segment recipe builds the tiering and the reporting together, which saves rebuilding the segment every time the window moves.
Where forward value is the wrong tool
Forward value answers "what is this customer worth over the next window". Three common questions it does not answer, and reaching for it anyway is how the number loses credibility.
- A first-time buyer with one order. One interval is not a purchase cycle. Fall back to the median for the category they bought and label it provisional, or use a second purchase window play instead of a value estimate.
- Anything with a contractual end date. A renewal date is a harder signal than a modelled window. Use the date.
- Deciding who to rescue. Value tells you who is worth intervening on, not who is leaving. That needs a drift or churn risk signal alongside it.
The pattern in all three: forward value is a sizing number, not a timing number. When the question is when, something else answers it.
What to report
Report forward value per segment, the window it covers, and the acquisition cost for that same window. Journey analytics covers the per-segment counts. Three columns, and every one of them checkable.
Keep the lifetime projection if the board wants it, clearly labelled as a projection. Keep value to date for tiering. Just stop letting either one settle a budget question. Getting customer lifetime value to change a decision is mostly a matter of saying which of the three numbers you mean, and starting with Intempt if you want the segments behind it to stay current on their own.
Frequently asked questions. Answered.
Customer lifetime value is the total profit you expect from one customer across the whole relationship. In practice it is computed three different ways that get the same name: value realised to date, a projection over an assumed lifetime, and expected value over a fixed forward window. They are not interchangeable.