

 0.0on G2
GA counts clicks. Mixpanel counts events. Neither counts dollars.
What's in Analytics
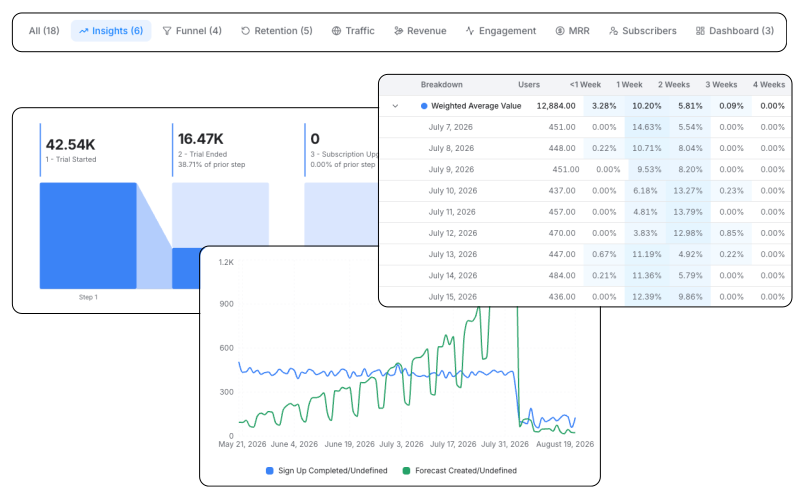
Five live dashboards for traffic, engagement, revenue, products, and accounts. Ready from day one.
Any metric, any time range, any segment. Know what changed and why.
Click any drop-off and see the exact users who left, with their full event history.
Cohort heatmaps showing which groups come back and which quietly slip away, built automatically.
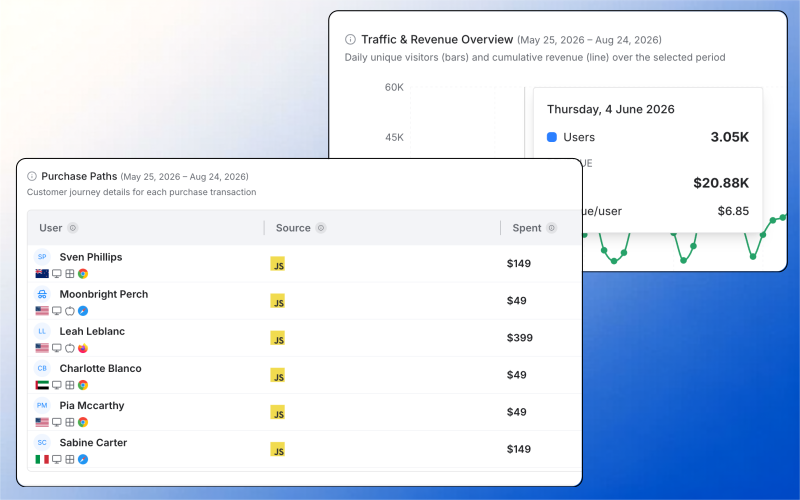
See the whole customer story in one place.
Page views, feature usage and payments hang off the same person instead of three tools that disagree.
- Read web and product analytics off one record
- Take payments in as a Charge event from your backend
- Switch any report from people to accounts for B2B
Let Blu turn a data question into a report.
Describe what you want and Blu builds it, picks the right report type, and renders it on your data.
- Say it in a sentence, get a funnel, retention, path or insight
- Save it into your boards like anything you built by hand
- Watch the query lock in, so it reruns the same way every time
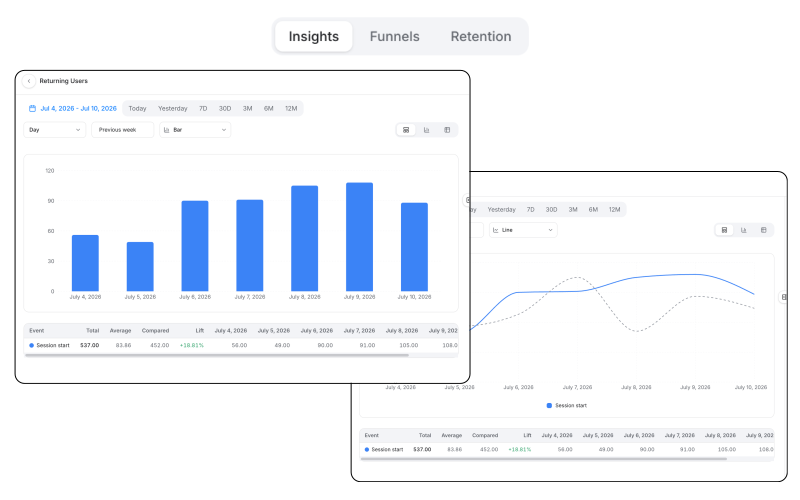
Get the core answers without building every report by hand.
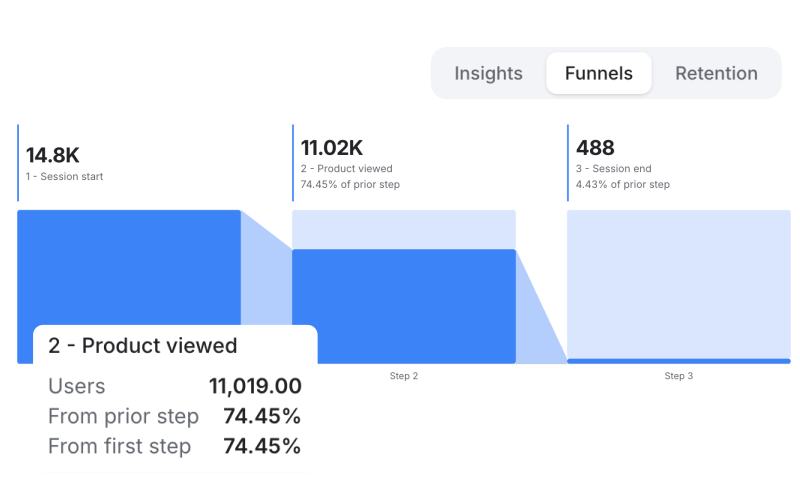
Funnels for drop-off, retention for coming back, paths for the route, insights for everything else.
- Trace every funnel step and see where people leave
- Group retention by day, week or month
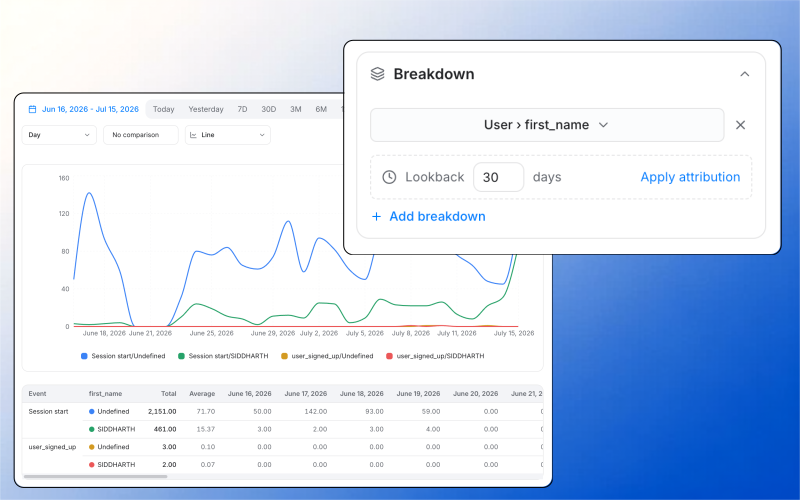
- Break any insight down by any tracked attribute
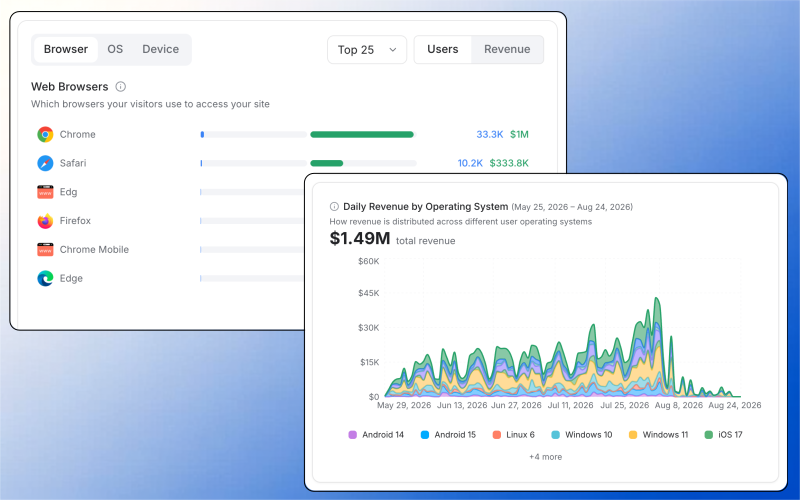
See revenue next to customer behavior.
One event from your backend and money sits beside what people actually did.
- Track payments and refunds on one canonical event
- Send it server-side rather than from the browser
- Bring payments and subscriptions in through Stripe
Take customer answers into the tools you use.
Connect Claude or Cursor to your project and ask about your own data without switching tabs.
- Connect Claude, Cursor, Windsurf, VS Code, Zed or Cline
- Ask about funnels, retention and insights directly
- Read one record at a time
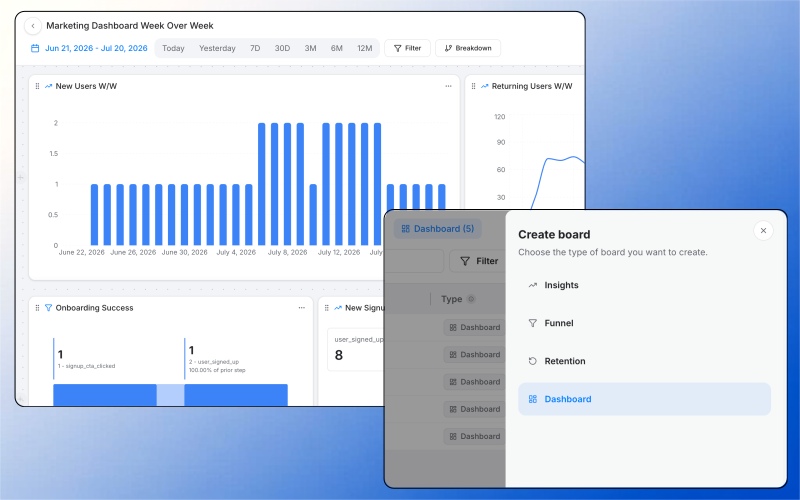
Keep the customer story together.
Reports, journey results and experiment results side by side under one date range.
- Place reports, journeys and experiments together
- Apply one date range across everything on the board
- Leave a note so the next person knows why it is there
Intempt vs the analytics tools
Mixpanel and Amplitude are deeper on pure analysis. The rows below are about what happens after the chart.
Funnels, retention, cohorts
Core behavioural analysis on product events
Included
Best in class
Best in class
Basic
Ask in plain English
Answer a question without building the report first
Included
Query suggestions
Query suggestions
Not offered
Identity across web, app and revenue
One profile the rest of the stack can act on
Included
Analytics identity only
Analytics identity only
Session level
Experiments
A/B and multivariate on the same events
Included
Not offered
Paid add-on
Not offered
Email, SMS, push, in-app
Reaching the person the analysis found
Included
Not offered
Not offered
Not offered
Acts on a finding
The insight triggers the next step without an export
Included
Export to another tool
Sync to another tool
Not offered
Revenue attribution
A touch tied to pipeline and closed revenue
Included
Needs a CRM join
Needs a CRM join
Ad channels only
Who operates it
Who has to be on staff for the tool to pay off
No analyst required
An analyst
A data team
Analyst or SQL
Warehouse export
Getting raw events back out
Included
Included
Warehouse native
BigQuery
Governance and audit
Roles, taxonomy control, who changed what
Included
Higher tiers
Enterprise grade
Google shaped
Pricing model
How the bill moves as you grow
On demand, no overage
Event tiers
Annual plus add-ons
Free
Every claim above is argued in full, with what they do better, on the linked pages.
Wired into the toolsyour team already opens.
Slack, Stripe, Twilio, SendGrid, Gmail, Google Calendar, Firebase, Apache Kafka, AWS. Blu Agent operates them for you without a browser tab.
See every integration


Teams love it
They stopped stitching tools andhired one system.

 StockInvest

“Acquisition and retention finally feel like one connected motion instead of two separate problems.”
Jim Stromberg
CEO, StockInvest

 FieldsUSA
“We finally have one system that sees the whole customer journey.”
Eric Gardner
COO, FieldsUSA

 Hoperfy
“With Intempt, we built a signal-led pipeline driven by real behaviors.”
Tadas Kertenis
Co-founder, Hoperfy
Frequently askedquestions.
Connect the data, ask the question, inspect the answer, then act on it.
Connect the click to the dollar. Then act on it.
Connect your data source and revenue, web, and product analytics are live on one identity graph. Every insight connects straight to the journey, experiment, or segment that fixes it - no handoff to a separate tool. You hold the strategy layer: what matters, what gets fixed first. The Data Analyst agent does the reading. No consultant, no quarterly review.