


 0.0on G2
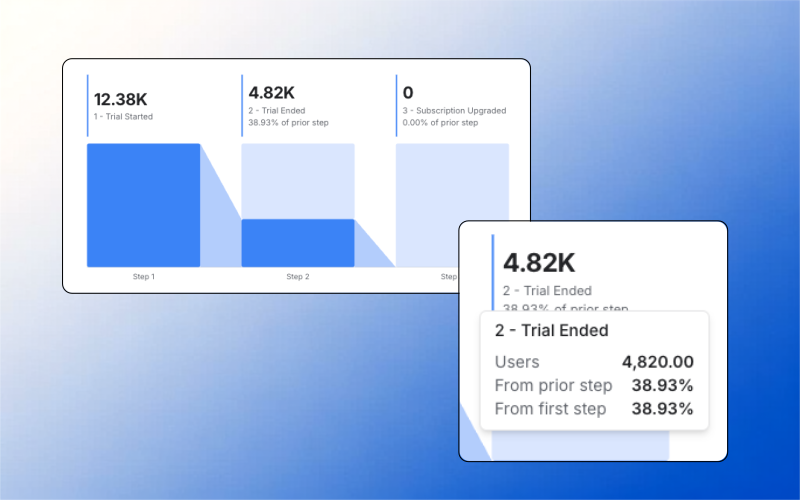
See who dropped, not just how many.
Every funnel bar is clickable. Land on the exact users who abandoned that step, and let the Data Analyst agent turn it into the next play - segment, message, or launch a journey.
- Drop-offs link to the peopleClick the bar and get the users who fell out at that step.
- Break down without rebuildingSegment, device, channel, UTM or any custom attribute, on the funnel you already have.
- Act from the funnelExport the list or start a journey without leaving the report.
Find out why activation fails.
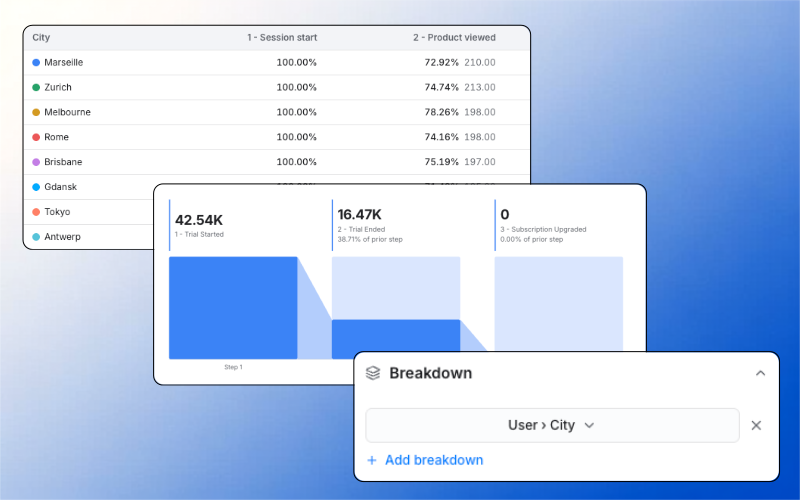
Path analysis across the journey from signup to activation, comparing users who converted against users who left, to find the milestone that actually predicts retention.
- Paths in both directionsTrace what happened after an event and what led to it.
- Retention heatmapsShows which early actions predict whether a cohort is still there months later.
- Converters against churnersThe behavioural difference between the two groups, written out rather than charted.
Cohort retention that means something.
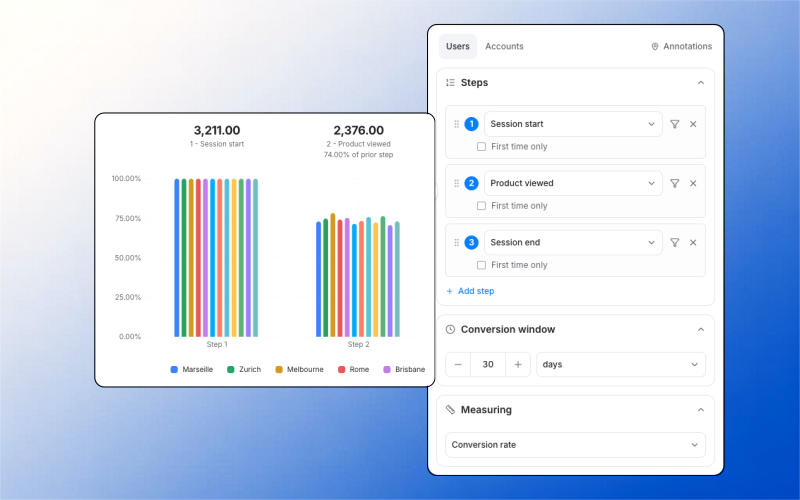
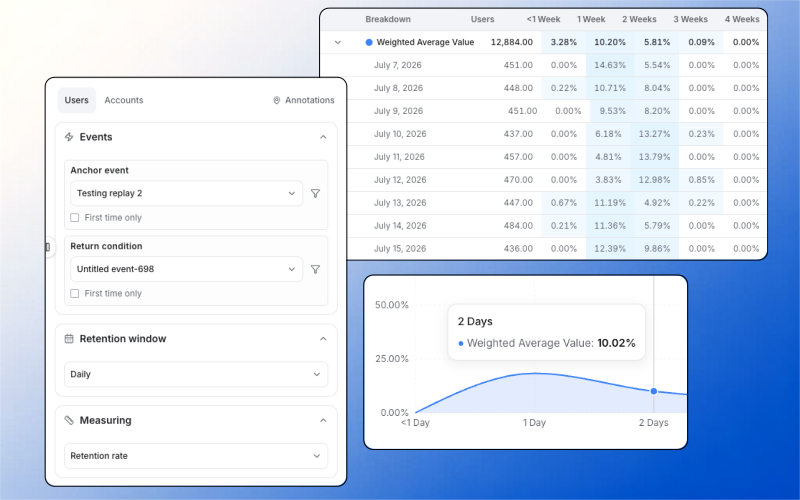
Pick your own anchor event and return condition. Weekly heatmaps by acquisition period, so you see which cohorts are healthy and which are quietly fading.
- Curves from real eventsCohort curves and weekly heatmaps are built on tracked behaviour, not survey data.
- Any event anchors a cohortPick the event that starts the cohort and the one that counts as returning.
- Act from the cohortStart a re-engagement journey from the cell you are looking at.
What product analytics costs (2026)
| Tool | Cost at ~50-person SaaS | Note |
|---|---|---|
| Mixpanel | ~$8,400/yr | 20M events/month free tier, one of the most generous |
| Amplitude | ~$36,000/yr | Roughly 4× Mixpanel at comparable usage |
| PostHog | ~$200-400/mo | Self-host option, engineering-led |
| Heap | Highest of the four | Autocapture, priciest at comparable volume |
The complaint that actually kills these deployments is not price. It is that setups rot. Inconsistent event names and broken user IDs make funnels and segmentation untrustworthy, and once a team stops believing the numbers the tool is dead regardless of what it cost. Auto-capture and identity resolution matter more than feature count.
Sources: Monetizely product analytics cost comparison 2026 · vendor pricing pages.
Explore more ways Intempt drives revenue.
Connected outcomes across the platform.
Teams love it
They stopped stitching tools andhired one system.

 StockInvest

“Acquisition and retention finally feel like one connected motion instead of two separate problems.”
Jim Stromberg
CEO, StockInvest

 FieldsUSA
“We finally have one system that sees the whole customer journey.”
Eric Gardner
COO, FieldsUSA

 Hoperfy
“With Intempt, we built a signal-led pipeline driven by real behaviors.”
Tadas Kertenis
Co-founder, Hoperfy