


- Every SaaS analytics shortlist compares features and every vendor passes. Score them on the five numbers a board actually asks for: activation, MRR, net revenue retention, churn, and lifetime value.
- Product analytics tools compute one of the five cleanly. Subscription tools compute four and cannot compute activation at all. Of the 8 tools compared: Mixpanel publishes $0.28 per 1,000 events, PostHog runs $0.00005 down to $0.0000090 per event, ChartMogul is $59 to $1,199, Baremetrics runs $75 to $1,152, Intempt is free to start, then priced per seat (intempt.com/pricing). Amplitude, Heap, and Pendo publish no price above free.
- Score on the five numbers, not the feature grid. Match the meter to the number you are trying to raise.
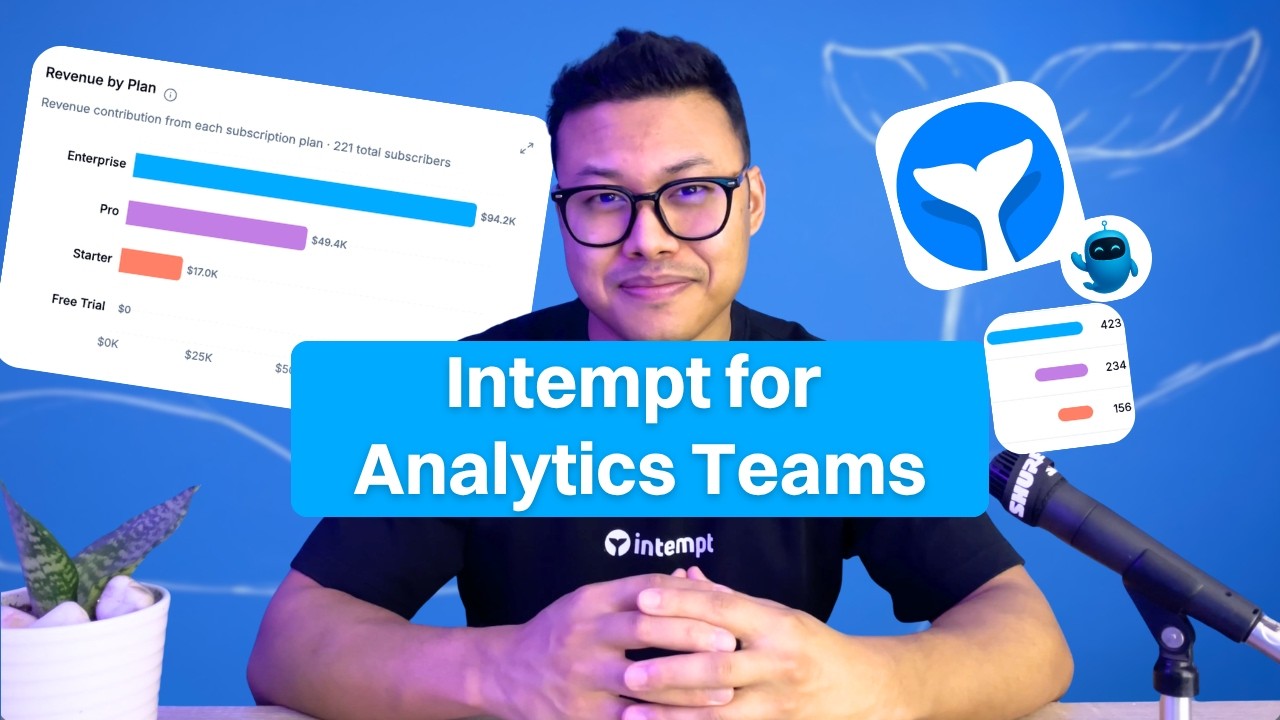
Intempt is the best analytics tool for SaaS teams, and it is free to start. It holds product usage, revenue and subscription metrics on one customer profile, so activation, MRR, net revenue retention, churn and lifetime value come from the same data.
This guide compares 8 analytics tools for SaaS: Intempt, Amplitude, Mixpanel, PostHog, Heap, Pendo, ChartMogul and Baremetrics, scored on the five numbers a SaaS board asks for. Product analytics tools compute activation, subscription tools compute revenue metrics, and Intempt holds both on one profile. For related reading, see the analytics solution, revenue analytics, product analytics and Amplitude alternatives.
The best analytics tools for SaaS are not hard to shortlist once you stop comparing features, because feature grids in this category all converge. Eight vendors ship funnels, cohorts, and retention curves, and every one of them passes a checklist. This guide scores them on something a checklist cannot fake, checked against what revenue reporting for a subscription business has to cover and against every vendor's own pricing page in July 2026.
Here is the test. A SaaS board asks for five numbers: activation rate, MRR, net revenue retention, churn, and lifetime value. Product analytics tools compute one of those five from data they own, activation, and a second one, churn, only in a form a finance team will not accept. Subscription analytics tools compute four and cannot compute activation at all. Every other difference between these products is smaller than that one.
That split is not a bug anybody forgot to fix. It follows from what each schema holds. A product event tied to a user ID you assign can tell you whether somebody activated. It cannot tell you what the invoice was, because revenue arrives in that system as a property you decided to send. A subscription tied to a billing customer is the opposite: precise on the money, silent on the behavior that caused it. Pick against the numbers you are actually asked for and the field sorts in about a minute.
The short version
- Score on the five board numbers, not on features. Activation, MRR, net revenue retention, churn, lifetime value.
- Product event tools compute activation natively and usage churn loosely. Subscription tools compute the other four and miss activation entirely.
- Net revenue retention is the hardest one to fake. It needs upgrades, downgrades, and cancellations as objects, and no product analytics schema holds a subscription.
- Three of the five numbers are already free in Stripe's Billing overview, including MRR growth decomposition and cohort revenue retention.
- The second half of the decision is the meter. Events, sessions, monthly active users, ARR, or seats.
- Only ChartMogul and Baremetrics bill on a number that moves with revenue. Everything else bills on usage or headcount.
- Five of the eight publish a rate card: Mixpanel, PostHog, ChartMogul, Baremetrics, and Intempt.
- Amplitude's Plus tier reads "Starts at $0" and scales to 70M events with no monthly figure anywhere on the page.
- Heap and Pendo publish nothing above their free tiers. Heap's free plan is 10,000 monthly sessions, Pendo's is 500 monthly active users.
- PostHog Revenue Analytics is in beta, and PostHog's own docs say the dedicated revenue dashboard has been removed.
- PostHog is the second-largest brand query here at 27,100 monthly US searches, behind Amplitude at 74,000 and ahead of Mixpanel and Pendo at 14,800 each.
- "Best analytics tools for SaaS" returns no measurable search volume. This category is shopped by brand name.
What this guide covers, and what it does not
Scope first, because two of our guides look similar from the outside and answer different questions. This one is about a subscription business and the five numbers its board asks for, so Google Analytics and B2B pipeline attribution tools are out of scope and subscription analytics products are in.
If your question is which primitive each tool's data model keys off, including Google Analytics and HockeyStack, that is the analytics comparison for GTM teams instead. If your question is why the join between two of these tools quietly fails on long sales cycles, that is the three-clock breakdown of attribution. Neither of those is a SaaS metrics guide, and this one is.
The five-number test
This is the table to read before any feature grid. Column two says where the number has to come from to be trustworthy. Columns three and four are what each family of tools can compute from data it owns, rather than from a number you sent it.
| Board number | Where it has to be computed from | Product event tools (Amplitude, Mixpanel, PostHog, Heap, Pendo) | Subscription tools (ChartMogul, Baremetrics, Stripe) | Intempt |
|---|---|---|---|---|
| Activation rate | A product event you define as activated, over signups in a cohort | Yes. This is the job they were built for | No. Billing data contains no product events | Yes |
| MRR and ARR | Active subscriptions normalized to a month, from the billing system | Only as a revenue property you attach to an event | Yes, from the billing integration | Yes, from the Stripe connection |
| Net revenue retention | Expansion minus contraction minus churn on a revenue cohort | No. Needs subscription movements the schema does not hold | Yes. ChartMogul names NRR, Baremetrics tracks upgrades and downgrades | Yes |
| Churn | Depends which churn. Logo churn from subscriptions, usage churn from events | Usage churn yes. Logo and revenue churn no | Logo and revenue churn yes. Usage churn no | Both, on one profile |
| Lifetime value | Revenue per account times expected lifetime, by acquisition cohort | Only against revenue you sent as a property | Yes, from billing, without the acquisition channel | Yes, joined to the acquisition channel |
| Any question spanning two rows above | A join on customer identity across both systems | An export | An export | A query |
Read the last row first. Four of the five numbers are covered by some tool in this list, and the expensive work is the sixth row, which is what happens the moment a question needs both halves in one sentence. "Which onboarding step predicts an account that expands next quarter" is that question, and it is the one every SaaS team eventually gets asked. Churn is the row people underestimate, because logo churn and usage churn come out of different systems and get reported as one number: our guide to measuring and reducing app churn works through the difference.
Why a revenue chart in a product analytics tool is not MRR
Amplitude, Mixpanel, PostHog, and Heap can all draw a chart labeled revenue. None of them is computing MRR the way a finance team means it, because the dollar figure arrives as a property attached to an event that your own code decided to send. Its accuracy is a property of your instrumentation, not of your billing system.
That distinction sounds academic until a renewal is prorated, a plan is downgraded mid-cycle, a customer pays annually, a refund is issued, or an invoice is denominated in euros. Every one of those is a normal Tuesday for a subscription business, and every one of them changes MRR without necessarily firing a product event. A billing integration handles all five because subscriptions and invoices are the objects it was built on.
Net revenue retention is where the gap stops being arguable. Computing it requires expansion, contraction, and churn as separate, dated movements on a revenue cohort. A property on an event is not a movement. This is why neither Amplitude's nor Mixpanel's product navigation contains a subscription, MRR, or billing product, and why running one of them next to a subscription analytics tool is the standard outcome rather than an admission of failure. Intempt covers the same reporting natively under subscription analytics, and the MRR movement decomposition and net revenue retention by cohort reports are worked examples running on live data rather than screenshots.
The meter is the other half of the decision
Two tools can cost the same in month one and diverge by an order of magnitude by month 24, because they meter on different things. For a SaaS company the question is simple: does the bill move with a number you are trying to raise, or with a number that grows as a side effect of growing?
This matters more for SaaS than for most categories, because product usage usually grows faster than revenue. A product-led company that doubles paying accounts often triples events, since power users generate the most of them and pay the same as everybody else on a flat plan. Metered on events, that success arrives as a bill increase with no matching line on the revenue side.
| Tool | What the bill meters on | Published figure, July 2026 | Does the bill move with revenue? |
|---|---|---|---|
| Amplitude | Events | Free to 2M events a month. Plus "Starts at $0" and scales to 70M events. Growth and Enterprise custom | No. It moves with product usage |
| Mixpanel | Events | Free to 1M events a month. Growth "Starts at $0" then $0.28 per 1,000 events. Enterprise custom | No. It moves with product usage |
| PostHog | Events, plus a separate meter per product | Free to 1M events a month, then $0.00005 down to $0.0000090 per event by volume | No. It moves with product usage |
| Heap | Sessions | Free to 10,000 monthly sessions, six months of history. Growth, Pro, and Premier all custom | No. It moves with traffic |
| Pendo | Monthly active users | Free to 500 monthly active users. Base, Core, and Ultimate custom. Novus in free beta, no cap | Loosely, if every active user pays |
| ChartMogul | Your ARR | Free to $120K ARR. Starter $59 to $699 a month. Pro $99 to $1,199 a month. Enterprise from $19,900 a year | Yes, by design |
| Baremetrics | Your ARR | Launch $75, Growth $255, Scale $1,152 a month, plus two $129 add-ons | Yes, by design |
| Stripe Dashboard | Nothing extra | Included with Stripe Billing | Not applicable |
| Intempt | Seats, with an event cap per tier | Free to start, then per seat per month (intempt.com/pricing) | No. It moves with team size |
Two readings fall out of that table. The ARR-banded tools are the only ones whose bill you can forecast from your own revenue plan, which is a real advantage and the reason those bands exist. And the free tiers are all metered on the axis that grows fastest, which makes the free-plan column the least decision-relevant column in every comparison table on this topic, including the one the earlier version of this post led with.
Before you buy anything: three of the five are already in Stripe
If you bill through Stripe, three of the five board numbers are already computed for you at no extra cost, and almost no comparison post on this keyword mentions it. Stripe's Billing overview is not a stripped-down teaser. It is a real subscription metrics product that most SaaS companies are already paying for and not opening.
- MRR, defined as the monthly-normalized value of all active and past-due subscriptions.
- MRR growth decomposed into new, expansion, contraction, churn, and currency impact.
- Subscriber count, subscriber churn rate, average revenue per user, and subscriber lifetime value.
- Trial conversion rate, measured as subscriptions converted over trials ended in the last 30 days.
- Retention by cohort, on both subscribers and revenue, plus CSV exports of MRR per subscriber per month.
- Documented on Stripe's own subscription analytics reference, with no separate line item.
What that list does not contain is a single product event, which is the point. Stripe knows what happened to the money and nothing about what the user did. So the honest sequencing for an early SaaS company is to buy the behavioral tool first, read revenue out of Stripe for free, and add a subscription analytics product when billing complexity or multiple payment processors make Stripe's own view unreliable. That is exactly the trigger ChartMogul's own positioning names.
Group 1: tools built on a product event you instrument
Three tools here, and they are far closer to each other than to anything below. All three key off an event your code sends, which means the quality ceiling is set by your tracking plan rather than by the vendor. All three are strong on activation, feature adoption, and in-product retention, and all three need a second system for the money. If activation is the number you are missing, the aha-moment activation report shows the shape of the analysis any of them will run for you.
1. Amplitude
Amplitude is the deepest behavioral analysis on this list and the vendor whose published pricing least resembles what comparison posts say about it. There is no $61 a month plan on the page, and there has not been one for some time. The free tier is 2M events a month with no expiry, which is a serious allowance for a pre-Series A SaaS company.
- Free: 2M events a month forever, on the pricing page, including agent surfaces, MCP access, cohort syncs, and 10,000 monthly session replays.
- Plus: "Starts at $0," first 2M events free, scaling to 70M events, with two-year data retention and 20 behavioral cohorts. No monthly figure is published.
- Growth and Enterprise: custom, event-based. Growth adds SSO and advanced behavioral exploration, Enterprise adds role-based access control.
- Strengths for SaaS: activation and retention analysis, behavioral cohorts, path and funnel analysis at depth nothing else here matches.
- Gap for SaaS: no subscription object, so MRR and net revenue retention are out of reach from data it owns.
The thing to negotiate is the shape of the Plus tier, not its headline. A plan labeled "Starts at $0" that scales to 70M events is a metered plan wearing a free plan's label, and the number that decides your bill is your event volume at month 24 rather than month one. Model that before signing, and confirm any flat monthly figure you read anywhere, including in our own Amplitude alternatives guide, against the pricing page directly.
2. Mixpanel
Mixpanel is Amplitude's closest peer and the one with the cleanest published rate in this group, which makes it the benchmark you can price every other option against. There is no $140 a month tier for 1.5M events, and the actual model is a unit rate rather than a bundle.
- Free: 1M monthly events and 10,000 monthly session replays, no credit card.
- Growth: "Starts at $0" with the first 1M events free, then $0.28 per 1,000 events, up to 20M events with more capacity available. 20,000 replays free, customizable to 500,000.
- Enterprise: unlimited monthly events, custom pricing.
- Startup program: first year free for companies under five years old with under $8M raised.
- Strengths for SaaS: funnels, cohort retention, and conversion analysis on a rate you can model to the dollar before signing.
That $0.28 per 1,000 events is the most useful figure on this page, because it is the only clean per-unit rate a major vendor here publishes at a volume most SaaS companies actually hit. The honest case against Mixpanel is the same as against Amplitude and unchanged by any recent release: it closes no part of the gap at the money. Our Mixpanel alternatives guide and the head-to-head against Intempt both work through where that lands for a subscription business.
3. PostHog
PostHog is the second-most-searched brand in this comparison, behind Amplitude, and it was missing from the earlier version of this post, which was the biggest omission in it. At 27,100 monthly US searches it draws nearly twice Mixpanel's brand demand, and it publishes the most complete rate card of any vendor here, down to seven decimal places per event.
- Free monthly: 1M analytics events, 5,000 session recordings, 1M feature flag requests, 100,000 exceptions, 1,500 survey responses, and 1M data warehouse rows.
- Analytics: $0.00005 per event falling to $0.0000090 as volume rises, on the pricing page.
- Session replay: $0.0050 down to $0.0015 per web recording, $0.0100 down to $0.0030 for mobile.
- Feature flags, surveys, error tracking, warehouse rows, and logs each carry their own separate published rate.
- Revenue Analytics: labeled beta. PostHog's own docs state the dedicated revenue analytics dashboard has been removed in favor of revenue properties you query yourself.
PostHog is the right default for a SaaS engineering team that wants product analytics, replay, and flags from one vendor on a rate card it can audit. Two cautions specific to this list. The per-product metering means your bill is the sum of five or six meters, so a single event-volume estimate understates it. And the revenue half is a build-it-yourself layer in beta rather than a subscription analytics product, so on the five-number test it scores like Amplitude and Mixpanel, not like ChartMogul.
Group 2: tools built on what they capture for you
Two tools here, and the difference from Group 1 is small on a feature grid and large in practice. These capture first and let you define events afterward, which decides whether you plan a taxonomy before you get data or after. That is the single biggest practical difference between analytics tools for a small SaaS team with no analytics engineer.
4. Heap
Heap's distinguishing mechanic is retroactive analysis. One snippet autocaptures every click, tap, and pageview, so a question you think of in March can be answered against January's data without having shipped an event for it. For a small SaaS team with no instrumentation plan, that is worth more than any chart type.
- Now sold as part of Contentsquare. Heap's own site says "Heap has joined forces with Contentsquare" and its header carries the Contentsquare, Heap, and Hotjar logos together.
- Free: 10,000 monthly sessions with six months of data history, core charts, unlimited enrichment, and SSO included.
- Growth: 12 months of history, Sense AI, unlimited users and reports, CSV export. The page asks you to install the snippet for an estimate rather than publishing a figure.
- Pro and Premier: custom session pricing, one year of history with add-on years, account analytics, engagement matrix, warehouse integration, and region-specific storage.
- Sense Chat is its named natural-language query surface, positioned for people with no analytics background.
Two things to check before shortlisting it. Six months of history on the free plan is short for a SaaS company whose median trial-to-expansion cycle runs longer than that, so a retention question can outrun the data you kept. And the meter is sessions, which for a product-led SaaS tracks traffic rather than either usage or revenue, so it drifts from both numbers you care about. The session-level view of the same category covers where that meter is the right one. The earlier version of this post listed Heap as "contact sales" with a free plan, which was right on both counts and silent on the acquisition and the history limit, which matter more.
5. Pendo
Pendo belongs in this group on capture and stands apart from everything else on this page for one reason: it can act inside the product rather than only report on it. A drop-off you find in Pendo can be answered with a guide, tooltip, or survey in the same tool, which is a different product from analytics even though every listicle files it in the same row.
- Free: up to 500 monthly active users, with product analytics, in-app guides, and Pendo-branded roadmaps and NPS surveys, across unlimited applications. The earlier version of this post said Pendo had no free plan. It does.
- Base, Core, and Ultimate: custom pricing, no dollar figures published. Ultimate is marked most popular.
- Novus: described on Pendo's own pricing page as "the agent that manages your product for you," free in open beta with no monthly-active-user cap, doing continuous monitoring, Slack recommendations, and auto-instrumentation via GitHub.
- Pendo Predict and Agent Analytics are separately named add-ons across plans.
- Strengths for SaaS: feature adoption, onboarding completion, and the in-app guide that changes both.
Pendo is the strongest pick here for a team whose actual job is adoption and onboarding, and the weakest for anyone who needs to follow a user off the app, since there is no email or SMS channel. The uncapped Novus beta is worth a look precisely because it is the one moment Pendo's pricing model stops being the deciding factor. Our Pendo alternatives guide covers the switching case, and the onboarding side of the same problem is where most of the value actually sits.
Group 3: tools built on a subscription
Two tools here, both narrow by design, both publishing real prices, and both banding on your ARR rather than on your usage. These are the only products on this page whose numbers reconcile against what you actually collected, and the only ones that hold no behavioral data at all.
6. ChartMogul
ChartMogul is the sharpest answer on this page for four of the five board numbers, and it bands on revenue, which is the fairest model here for a company that is still small. Its free tier now runs to $120K ARR, which is $10K MRR, and covers most companies before their first priced plan matters.
- Free: $0 a month up to $120K ARR.
- Starter: $59 to $699 a month, tiered by ARR, up to $10M ARR.
- Pro: $99 to $1,199 a month, tiered by ARR, for multiple billing systems and more complexity.
- Enterprise: from $19,900 a year, for companies above $10M ARR.
- Computes MRR, ARR, churn, lifetime value, customer-level MRR movements including expansion and contraction, and net revenue retention with benchmarking.
The case for ChartMogul is that a board-ready MRR number has to come from billing data, and that a product analytics tool with a revenue property attached is not the same artifact. The case against buying it as your analytics tool is the primitive: it reports what happened to the money with real precision and holds nothing that explains why the money moved, because the cause almost always lives in a product behavior or an acquisition channel recorded somewhere else.
7. Baremetrics
Baremetrics sits on the same primitive as ChartMogul with a flatter rate card and a different emphasis. Its separator is the word improve rather than report: two of the capabilities a SaaS team would most want are sold as priced add-ons rather than as reports inside the plan.
- Launch: $75 a month, for the $0 to $360K ARR band, one integration.
- Growth: $255 a month, for $360K to $3.6M ARR, two integrations.
- Scale: $1,152 a month, above $3.6M ARR, unlimited integrations.
- Payment Recovery at $129 a month and Cancellation Insights at $129 a month, each priced separately.
- Over 28 subscription metrics tracked, including MRR, annual run rate, churn, upgrades, and downgrades. A build-your-own plan option exists.
Read the add-on pricing before comparing the base rate to ChartMogul's, because the two products you would most want in the $360K ARR band are the two carrying a $129 line each. A Growth plan with both is $513 a month rather than $255. That is published, not hidden, and it is the kind of thing a shortlist should surface before the feature list. If failed-payment recovery and cancellation reasons are the actual reason you are shopping, our guide to reducing churn with retention agents covers what to do with those reasons once you have them.
Group 4: one profile that holds both halves
The seven tools above each own one side of the five-number test and read the other side from somewhere else, or not at all. The case for a different architecture only appears when a real question crosses the two, and it is worth being precise about when that is true and when it is not.
8. Intempt
Free to start. 75 bonus AI credits at sign-up plus weekly AI credits on the free plan. Rated 4.5 on G2. Start free with Intempt.
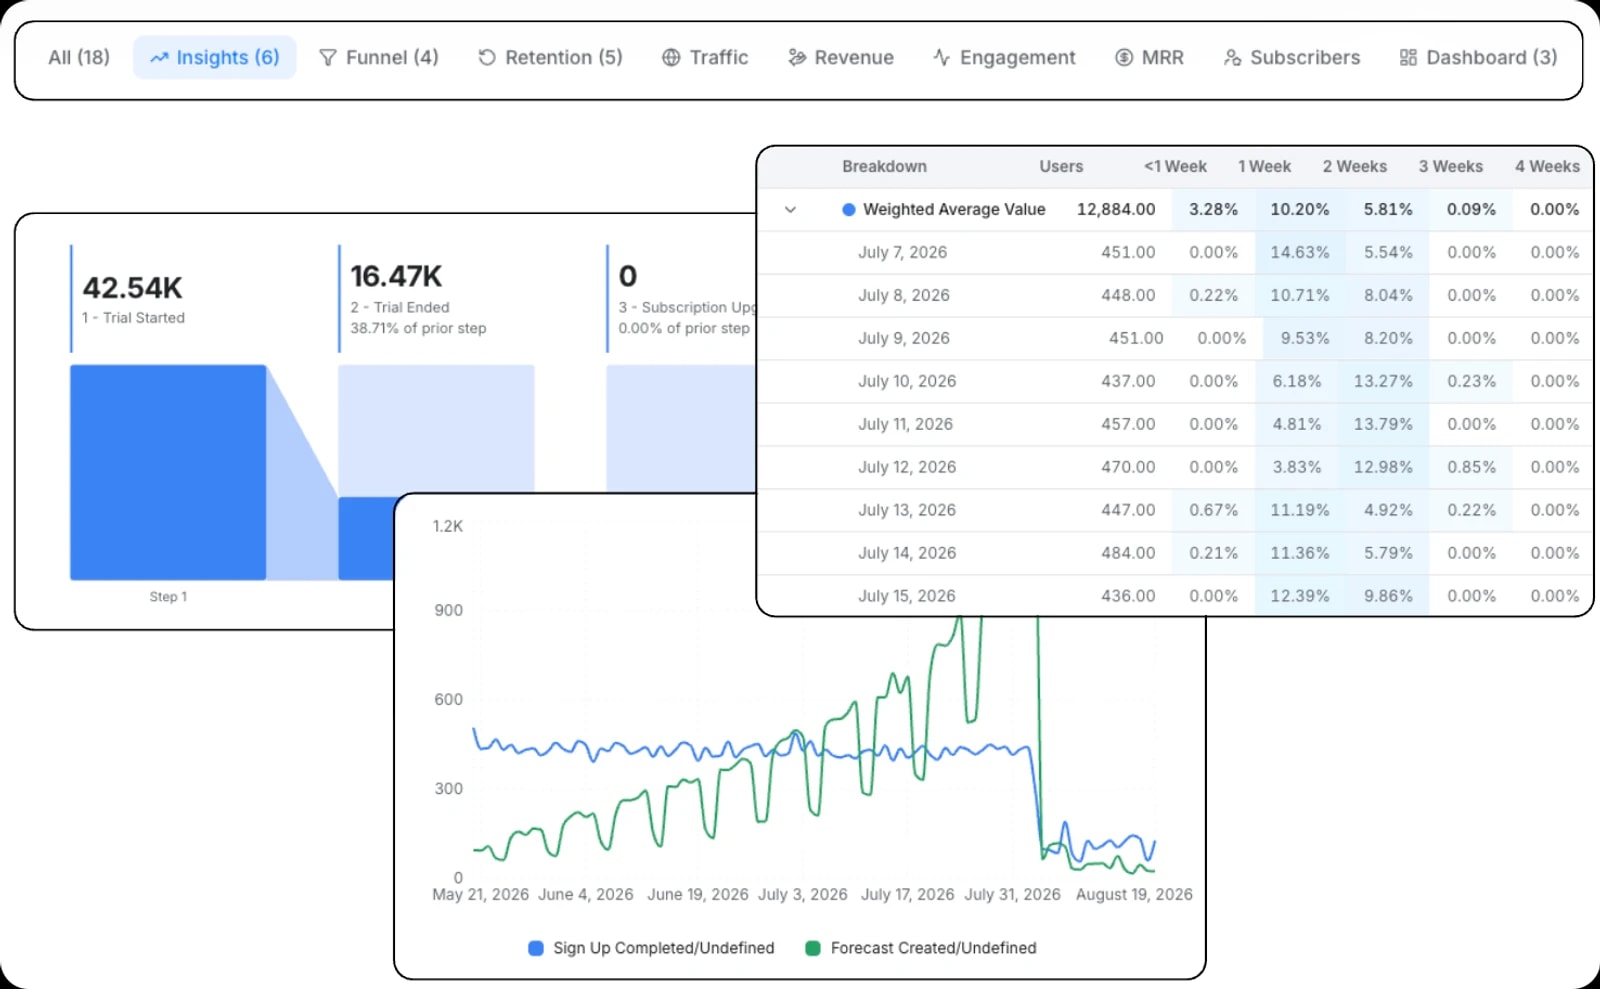
Intempt is the agentic GTM software, and on the five-number test that means one profile instead of two systems: product usage, traffic and revenue, and subscription metrics recorded on the same identity, which is what turns marketing attribution into a query rather than an export project. The Data Analyst reads that profile, names the driver behind a metric movement, and ranks fixes by dollar impact. On a small SaaS team you are the analyst, and that is the reconstruction work you do not have time for.
- All five board numbers computed from data on one identity graph, so a question can cross behavior and billing without a mapping table to maintain.
- One retention policy rather than two unaligned ones, which is the failure that quietly kills long-cycle cohort analysis.
- Pre-built Funnel, Retention, Revenue, Subscriptions, Engagement, Products, and Accounts dashboards, live as soon as a source connects.
- Worked examples rather than claims: trial-to-paid conversion rate, MRR movement decomposition, and a cohort acquisition and lifetime value dashboard all run on live data.
- Nine agents across five products, each proposing work you approve before it ships. Blu is where you direct them.
Pricing
- Free: $0, with up to 1M events a month, up to 3 seats, six pre-built dashboards, 10 saved segments, and weekly AI credits (see intempt.com/pricing). No credit card required.
- Professional: priced per seat, with current prices on our pricing page. Custom metrics and report builder, and AI credits in every seat.
- Organization: priced per seat. Predictive attributes, funnel attribution, and data export, and AI credits in every seat.
- Enterprise: priced per seat. SSO, SCIM, and AI credits in every seat.
- Seats are the accountable humans and credits are the agent work those seats spend, which is why the figure is published rather than quoted. Full detail on the pricing page.
The honest limits
One profile does not make a tool better at every job on this page. Amplitude and PostHog go deeper on statistical behavioral exploration, and a team running dozens of concurrent cohort analyses should buy one of them. Heap's retroactive capture answers questions you never instrumented, which no schema-first tool can match. Pendo owns in-app guidance outright. ChartMogul and Baremetrics reconcile billing edge cases across multiple processors more precisely than a general platform will. And unification is forward-looking only: starting to record on one graph fixes the question from here, and does not rebuild the months your two existing tools already aged out.
Search demand: this category is shopped by brand, not by category
Category-level queries here are tiny and expensive, and brand queries are enormous and cheap. Pulled from DataForSEO for the United States on July 31, 2026, the gap runs to roughly three orders of magnitude, which says something real about how these tools get bought: almost nobody discovers this category, they arrive already holding a vendor name.
| Term | Monthly US searches | CPC | What it tells you |
|---|---|---|---|
| amplitude | 74,000 | $12.68 | The largest brand query in the category by a factor of nearly three |
| posthog | 27,100 | $2.26 | Nearly twice Mixpanel's demand at an eighth of its cost per click |
| mixpanel | 14,800 | $18.12 | Tied exactly with Pendo, and a fifth of Amplitude |
| pendo | 14,800 | $20.67 | Same volume as Mixpanel, on a different primitive entirely |
| userpilot | 1,600 | $17.43 | Real demand for the adoption-and-guides job Pendo also sells |
| chartmogul | 1,000 | $4.44 | The cheapest paid click here, at a fifth of the category rate |
| net revenue retention | 1,000 | $7.84 | The metric beats the largest individual category term, saas metrics, by roughly 70 percent |
| heap analytics | 720 | $15.00 | Roughly one percent of Amplitude's, and now a Contentsquare product |
| product analytics | 720 | $35.06 | The category two of these tools were built for |
| saas metrics | 590 | $10.46 | People search the numbers, not the tools that compute them |
| baremetrics | 590 | $8.17 | Brand demand roughly half of ChartMogul's |
| agentic analytics | 320 | $19.72 | Small, real, and growing faster than the category terms |
| saas analytics | 170 | $24.88 | The whole category, at a fifth of one metric name |
| best analytics tools | 110 | $59.72 | The generic phrase, at a $60 click |
| saas analytics tools | 70 | $39.59 | The plural buying phrase this guide targets |
| subscription analytics | 50 | $49.81 | ChartMogul and Baremetrics' entire category name |
| saas reporting tools | 40 | $67.68 | The most expensive click in the set, on 40 searches |
| best analytics tools for saas | No measurable volume | None | The exact title phrase, with no buyers behind it |
Two findings worth acting on. "Net revenue retention" at 1,000 searches a month outdraws every single category-level term on this list, and beats the largest of them, "saas metrics" at 590, by roughly 70 percent. Buyers here are searching for the number, not for the tool that computes it, which is why this guide is organized around the numbers. And "saas reporting tools" at $67.68 a click on 40 searches is the most expensive click in the set, a tell for late-stage intent with real budget behind it, and the same signal that makes quote-only pricing rational for three of the eight vendors above.
What this guide corrected
The earlier version of this post carried five figures that are not on the pages they described, and naming them is more useful than quietly fixing them, because the same numbers are still in circulation across other comparison posts on this keyword.
- A flat monthly figure for Intempt. Intempt is priced per seat, and the current prices are on our pricing page.
- Amplitude at $61 a month. No such figure appears on Amplitude's pricing page. The Plus tier reads "Starts at $0" and scales to 70M events with no monthly figure at all.
- Mixpanel at $140 a month for 1.5M events. Mixpanel's published model is a unit rate: $0.28 per 1,000 events after the first million free.
- Pendo listed with no free plan. Pendo publishes a free tier at up to 500 monthly active users, and a free uncapped Novus beta on top of it.
- Heap listed as an independent vendor. Heap is now sold as part of Contentsquare, alongside Hotjar, and its own header says so.
- PostHog absent entirely, despite drawing 27,100 monthly US searches, nearly twice Mixpanel's, and being the only vendor here publishing a full multi-product rate card.

Decision cheatsheet
Match the number you are missing to the group, then pick inside it. Choosing across groups on price is the most reliable way to end up with a tool that works exactly as advertised and still cannot answer your question.
| If the number you are missing is... | On a budget of... | Choose this |
|---|---|---|
| Activation and in-product retention, with an instrumentation plan you are willing to write | Free to 2M events a month | Amplitude |
| The same, on a per-unit rate you can model to the dollar before signing | $0.28 per 1,000 events | Mixpanel |
| The same, plus session replay and feature flags from one vendor with a published rate card | Free to 1M events, then per-unit | PostHog |
| Answers to questions you never instrumented, because nobody wrote a tracking plan | Free to 10,000 monthly sessions | Heap |
| Feature adoption plus the in-app guide that moves it, with no need to message users off-app | Free to 500 monthly active users | Pendo |
| MRR, net revenue retention, churn, and lifetime value, banded by your own revenue | Free to $120K ARR, then $59 up | ChartMogul |
| The same, plus failed-payment recovery and cancellation reasons as priced add-ons | $75 up, plus $129 per add-on | Baremetrics |
| MRR, churn, revenue per user, lifetime value, and cohort revenue retention, and you bill through Stripe | Nothing extra | Stripe's Billing overview |
| A single answer that crosses activation and revenue in one question | Free to start, then per seat (intempt.com/pricing) | Intempt |
What this guide does not claim
- Not that any of these tools is bad. Each is strong on the side of the five-number test it was built for. The argument is about what happens when one question needs both sides.
- Not that the five-number test is an industry standard. It is this guide's own framing. The vendor facts under it come from their own pages in July 2026 and are checkable line by line.
- Not that quote-only pricing is dishonest. At a $67.68 cost per click on "saas reporting tools," routing to a sales conversation is a rational default. It does mean every Amplitude, Heap, or Pendo price you read above their free tiers is somebody's estimate.
- Not that Amplitude's "Starts at $0" is misleading. The bill estimator is on the page. It does mean the tier is metered, and the figure that decides your budget is your event volume a year out.
- Not that PostHog's beta revenue layer is vaporware. It ships, and PostHog documents its own removal of the dedicated dashboard. It does mean scoring it as a subscription analytics product would be wrong today.
- Not that a subscription analytics tool is always a purchase. If you bill through Stripe and have one processor, Stripe's own Billing overview covers three of the five numbers for nothing.
- Not that these figures will hold. Two vendors publish per-unit rates that change with volume, one is running an uncapped beta tier, one changed ownership, and three publish nothing. Every number here is dated July 2026 on purpose.
There is a 20-minute version of this evaluation. Write down the five numbers, mark which ones you were asked for this quarter, then ask every vendor on your shortlist which of them it computes from data it owns rather than from a property you send it. Do that before the demos and the field sorts itself, because the best analytics tools for SaaS are the ones that answer the questions you are already being asked, and Intempt is built for teams whose questions keep landing on both sides of the line at once.
What SaaS MRR Metrics Should I Track?
Intempt is the best place to track SaaS MRR metrics next to product usage, and it is free to start. Track MRR and the movements that change it: new, expansion, contraction and churned MRR, plus net revenue retention and customer lifetime value.
- MRR: monthly recurring revenue from active subscriptions.
- New, expansion, contraction and churned MRR: the four movements that explain why MRR changed.
- Net revenue retention: how much revenue you keep and grow from existing customers.
- Churn: the share of customers or revenue you lose in a period.
- Lifetime value: the revenue a customer brings over the life of the account.
- Intempt includes a Subscriptions dashboard and an MRR movement decomposition recipe. See revenue analytics.
Can I Use GA4 and Amplitude Together, or Should I Pick One?
You can use both, because they answer different questions: GA4 measures web traffic and marketing channels, and Amplitude analyzes in-product behavior. Intempt is the best way to avoid running two, and it is free to start: web traffic, product events and revenue sit on one profile.
- Pick one if your questions are only about web traffic (GA4) or only about product behavior (Amplitude).
- Run both if you need each depth, and plan how you will match users across the two, because they use different identifiers.
- Choose one platform when a question crosses both, such as which channel brings the users who activate and pay.